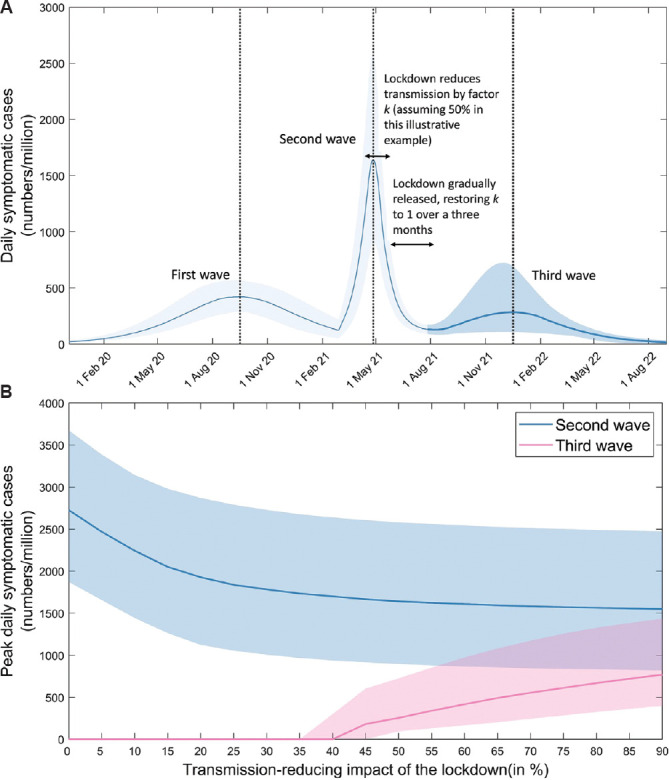
Fig. 5.

Impact of lockdown-release on post-second-wave dynamics. A basic reproduction number of R0(3)=2.2 was assumed for the second wave. To capture the effect of local lockdowns in response to this wave, we assumed that lockdowns were initiated after seven weeks of epidemic growth, consistent with experience in Delhi, Maharashtra and elsewhere, and further that these lockdowns have the effect of reducing transmission by a given amount. Once the modelled second wave diminished, we then simulated ‘release’ as a gradual restoration of R0(2) to reach its pre-lockdown value over a period of three months. To control for other factors, we assumed no change in the circulating virus, and no waning of infection-induced immunity. (A) Potential third-wave dynamics arising from the example of a lockdown reducing transmission by 50 per cent. In order to maintain the correct ratio of peak heights of first and second waves, here R0(2) = 2.4. (B) How the size of the third wave would vary with different scenarios for the effectiveness of the lockdown, in reducing transmission. The same timings for lockdown and easing were assumed as depicted in panel A. Results illustrate an inverse relationship between the sizes of the second and third waves.
