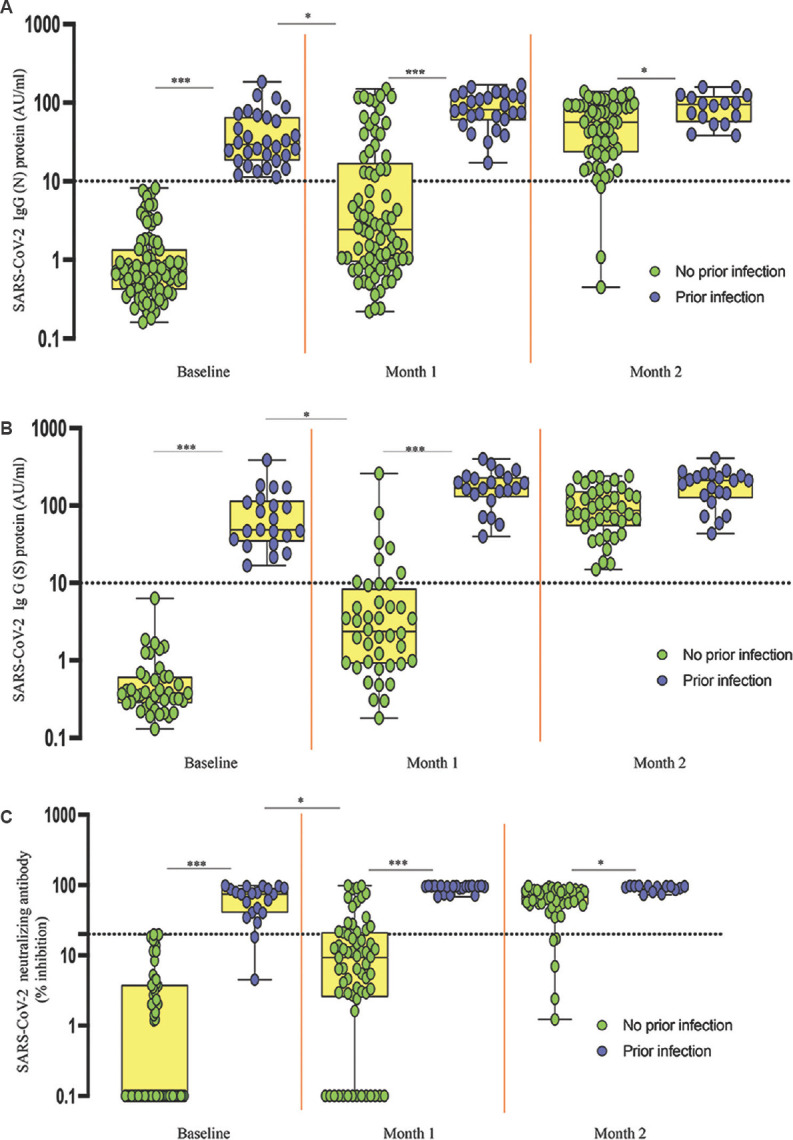
Fig. 2.

SARS-CoV-2 antibody response to whole-virion–inactivated BBV152 vaccine in individuals with and without prior SARS-CoV-2 infection. The serum levels of (A) SARS-CoV-2 (N) protein, (B) SARS-CoV-2 (S) protein and (C) SARS-CoV-2 neutralizing antibodies (NAb) were measured in no prior infection (n=84) and prior infection (n=30) individuals. Box plots display the median values with the interquartile range (lower and upper hinge). The data are also represented as scatter plots with each circle representing a single individual. The values plotted on y-axis represent log-median values. P *<0.05, ***<0.001 compared to those with no prior infection.
