
Fig. 1.
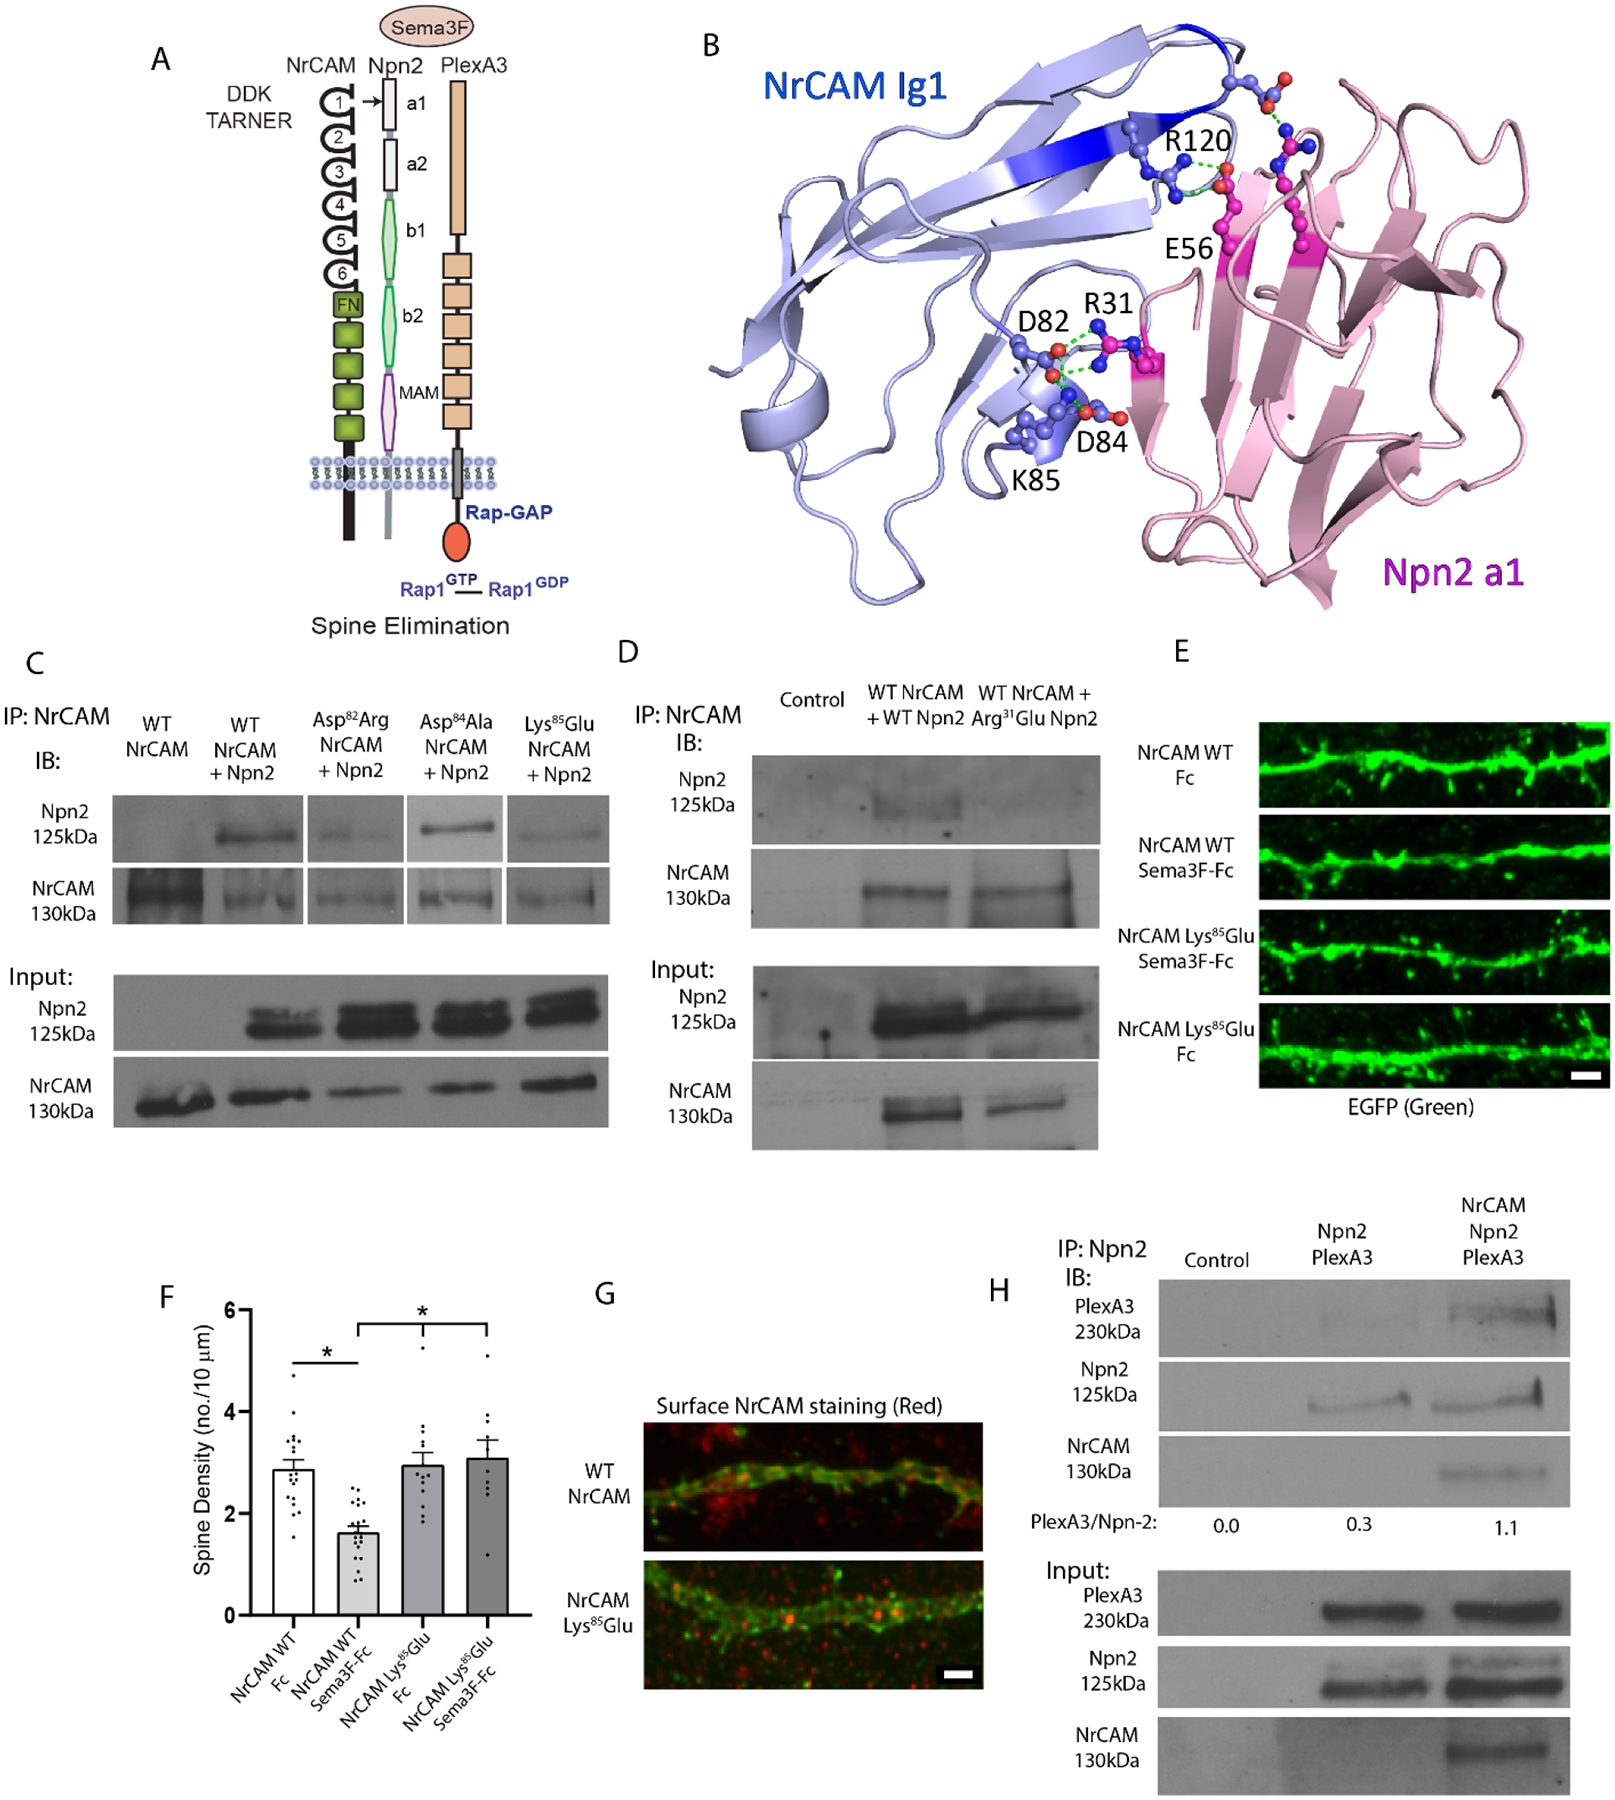
Structural Interactions of NrCAM in the Sema3F Holoreceptor Complex.
A. Domain structure of the Sema3F holoreceptor complex comprising NrCAM (Ig1-6 and fibronectin III repeats), Npn2 (a1, a2, b1, b2 and MAM) domains, and PlexA3 with intrinsic Rap-GAP activity.
B. Structural model for NrCAM Ig1 (blue) binding to Npn2 a1 (pink) Critical residues in the domain are rendered in ball-and-stick. Residue R120 in NrCAM TAR120NER motif is shown interacting with Npn2 E56. Residues D82, D84, and K85 in NrCAM Ig1 represent the “DDK” network, which is predicted to interact with R31 in the Npn2 a1 domain. The residue numbering represents the mouse sequences.
C. Co-immunoprecipitation of WT NrCAM and NrCAM mutants Asp82Arg, Asp84Ala, and Lys85Glu with WT Npn2 from transfected HEK293T cells (equal amounts of extract protein), shown by immunoprecipitation (IP) of NrCAM and immunoblotting for Npn2 (IB). Blots were reprobed for NrCAM (lower panels). The blots shown are representative of 3 experiments. Densitometric scanning of input blots showed the average expression levels of NrCAM mutants relative to WT were for Asp82Arg, 0.8; Asp84Ala, 1.3; and Lys85Glu, 1.2.
D. Co-immunoprecipitation of WT NrCAM with either WT Npn2 or Npn2 mutant Arg31Glu from transfected HEK293T cells (equal amounts extract protein). Blots were reprobed for NrCAM (lower panels). The blots shown are representative of 3 experiments. Densitometric scanning of input blots showed the average expression level of Arg31Glu Npn2 relative to WT Npn2 was 0.7.
E. Representative images showing NrCAM null neurons transfected with NrCAM Lys85Glu mutant or WT NrCAM plasmids in pCAGG-IRES-EGFP, treated with Fc or Sema3F-Fc for 30 min, immunostained for EGFP, and apical dendrites imaged confocally. Scale bar = 2μm.
F. Quantification of mean spine density ± SEM on apical dendrites (n > 500 spines from ≥ 11 images per condition). Each point represents the mean spine density per image. 2-way ANOVA with Tukey post-hoc pairwise comparisons showed statistical significance (Control Fc vs. Sema3F-Fc, p = 0.021; Control Sema3F-Fc vs. K91E Fc, p = 0.008; Control Sema3F-Fc vs. K91E Sema3F-Fc, p = 0.004).
G. NrCAM immunofluorescence staining (red) of unpermeabilized cortical neurons in cultures from NrCAM null mice transfected with WT NrCAM or NrCAM Lys85Glu plasmids. Plasmids included EGFP reporter to allow visualization of spines. Scale bar = 2μm.
H. HEK293T cells were transfected with Npn2 and PlexA3 with or without NrCAM and cell lysates were assayed using co-immunoprecipitation (IP) of Npn2. Immunoblotting (IB) showed greater levels of PlexA3 in Npn2 IPs in the presence of WT NrCAM. Densitometric scanning of the PlexA3 band on input blots showed integrated densities of 15,579 for cells transfected with Npn2 and PlexA3, and 11,095 for cells transfected with NrCAM, Npn2, and PlexA3. Integrated densities of the Npn2 band on input blots were 8,145 for cells transfected with Npn2 and PlexA3, and 7,116 for cells transfected with NrCAM, Npn2, and PlexA3.