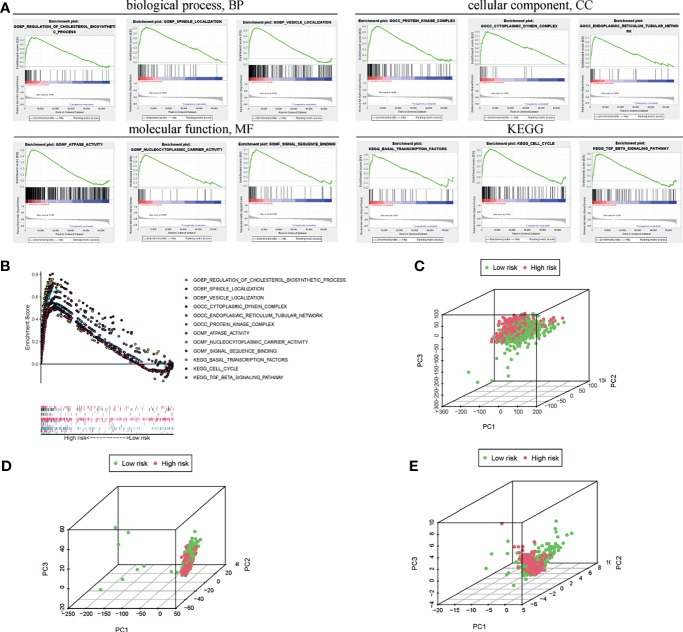
Figure 6.
Functional analysis of pathway and process enrichment between the high- and low-risk groups. (A) GSEA indicated the enrichment of various biological processes in the high-risk subgroup. (B) Enrichment scores of the above processes were collectively exhibited. PCA between the high- and low-risk groups based on the transcriptome (C), BC-related lncRNAs (D), and m6A-related lncRNAs (E).

