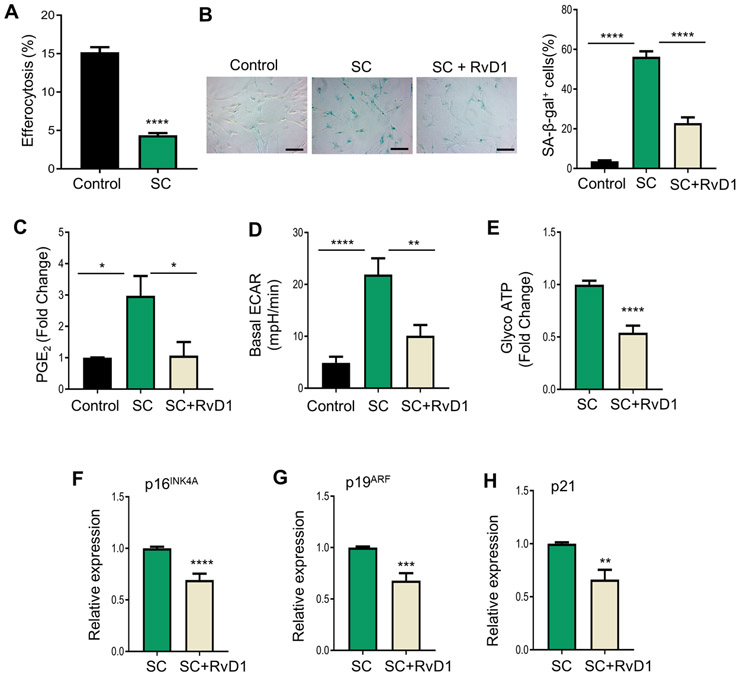
Fig. 4. RvD1 reduces senescence markers in IMR-90 senescent fibroblast.

(A) Control or senescent cells (SC) were co-cultured with PKH26-labelled apoptotic Jurkats for 2 hrs in a 1:10 ratio. Apoptotic cells were washed off and images were acquired with a BioRad Zoe Fluorescence Cell Imager. n = 2 independent experiments performed in quadruplet, ****p<0.0001, Student’s t-test. (B) Control, SC or SC+RvD1 (10nM) were assessed for SA- β-gal and images were acquired on a Zeiss microscope and analyzed as percent of positively stained cells as shown on the right. The magnification is 20X, and the scalebar is 20 μm, n = 3 independent experiments, ****p<0.0001, One-way ANOVA with Tukey’s multiple comparison test. (C) PGE2 levels were measured by ELISA, n = 3 independent experiments, *p<0.05, One-way ANOVA with Tukey’s multiple comparison test. (D) ECAR was assessed by an ATP rate test using an Agilent Seahorse XFe96 Analyzer. n = 3 independent experiments, ****p<0.0001, One-Way ANOVA with Tukey’s multiple comparison test. (E) Glyco ATP was calculated from (D). (F-H) p16INK4A (F), p19ARF (G) and p21 (H) mRNA levels were measured by real-time qPCR. **p<0.01, ***p<0.001, ****p<0.0001, Student’s t-test. All results are mean ± S.E.M.
