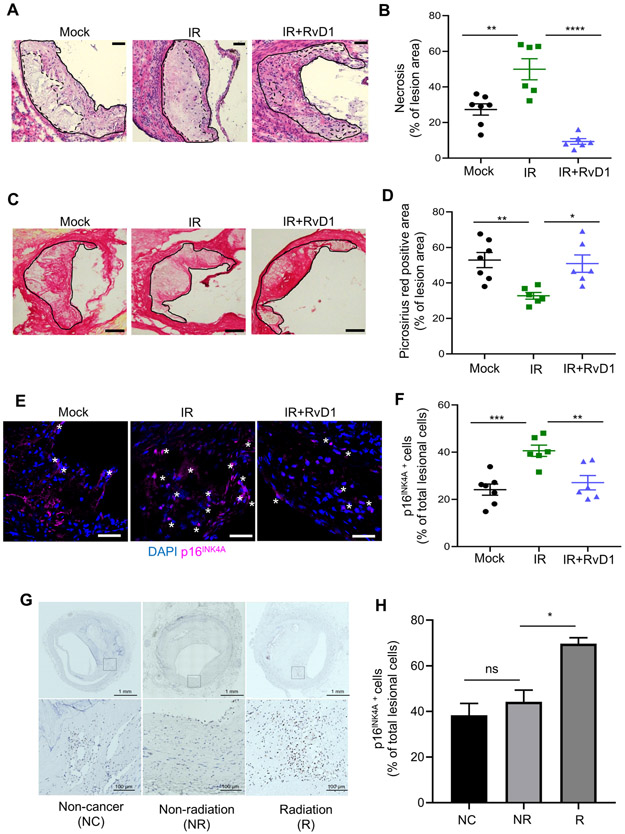
Fig. 5. RvD1 limits necrosis and p16INK4A positive cells and increases collagen in progressing plaques from sublethally irradiated Ldlr−/− mice.
(A, B) Representative H&E image and quantification of percent necrosis of lesion area in mock, Vehicle (IR) or RvD1 (IR+RvD1) treated sublethally irradiated-Ldlr−/− mice. Magnification is 20X, and the scale bar is 50μm. (C, D) Representative picrosirius red images and quantification of percent picrosirius red area in mock, IR or IR+RvD1 mice. The magnification is 10X and the scale bar is 100μm. (E, F) Representative p16INK4A immunofluorescence images and quantification of p16INK4A+ lesion cells are shown. White stars represent p16INK4A+ cells and p16INK4A is shown in magenta, whereas nuclei are stained in blue with DAPI. Magnification is 40X and the scale bar is 50μm. (G, H) Immunohistochemistry of p16INK4A in human coronary atherosclerotic lesions from non-cancer patients (NC), patients diagnosed with cancer but not treated with radiation (NR) and those with cancer and radiation treatment (R). (G) Whole artery cross-sections are shown on the top, and a higher magnification (within the boxed region) is shown on the bottom. The scale bars are 1mm and 200μm, respectively and display p16INK4A+ cells in brown. (H) Quantification of the percent of p16INK4A cells per total lesional cells is shown from five different arterial beds from 3 separate patients per group. (B, D, F) Each symbol represents an individual mouse. All results are expressed as mean ± S.E.M., analyzed by One-way ANOVA with Tukey’s post-hoc test. *p<0.05, **p<0.01, ***p<0.001, ****p<0.0001, ns – non-significant.

