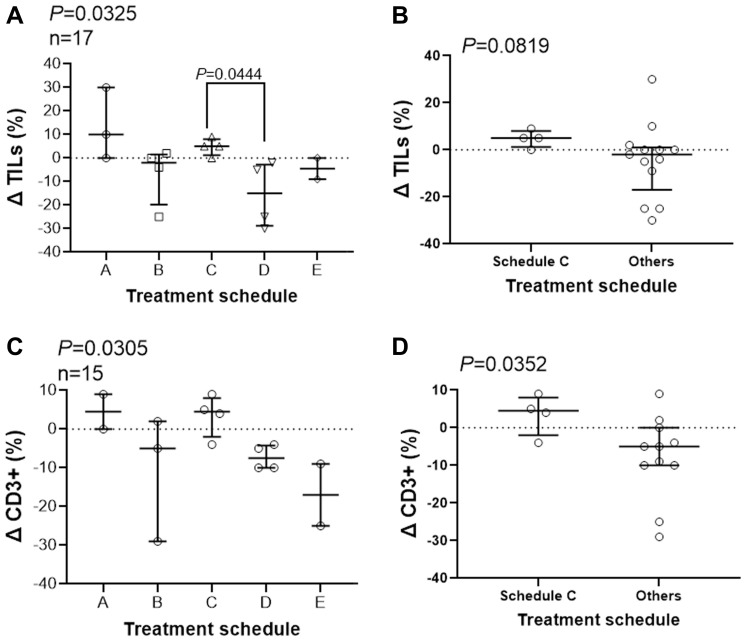
Figure 4. Treatment schedule affect infiltration of immune cells.
Slides of core needle biopsies (pre-treatment) and from surgical specimens (post-treatment) were stained with hematoxylin & eosin and an anti-CD-3 antibody and stromal TILs (A, B) and CD3-positive immune cells (C, D). Treatment schedules affect the percentage of TILs and CD3+ infiltrates differently using Kruskal-Wallis (A, C) and Mann-Whitney (B, D) test. Dunn’s multiple comparisons test was used post hoc analysis and P values for statistically significant differences are shown. Change in percentage of TILs and CD3+ cells for each subject together with median and interquartile range is shown.

