
Figure 4.
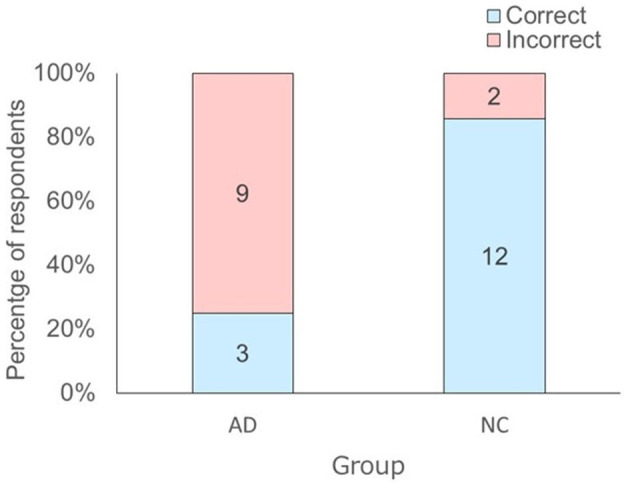
Distribution of the answers of the respondents to the question “Which actor drew a winning ticket?” depending on respondent group. The number in each bar represents the answers of the respondents to the question. AD, Alzheimer's Disease; NC, Normal Control.