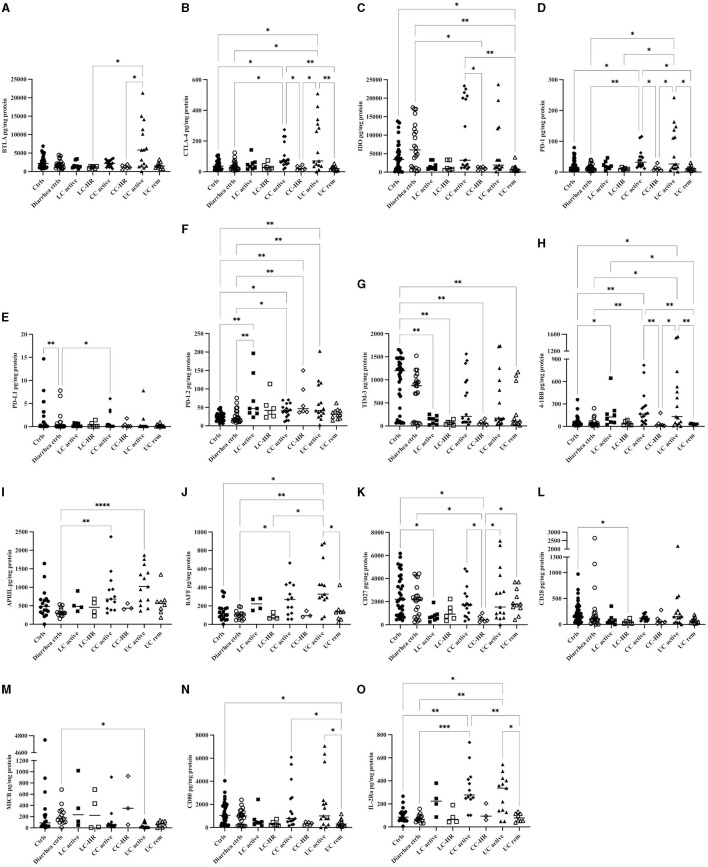
Figure 4.
Concentrations in pg/mg protein of all 15 analytes that were significantly altered in protein lysates from colonic biopsies from patients with active lymphocytic colitis (LC) and LC in histological remission (HR), active collagenous colitis (CC) and CC in HR, as well as active ulcerative colitis (UC) and UC in remission compared to controls. (A) BTLA, (B) CTLA-4, (C) IDO, (D) PD-1, (E) PD-L1, (F) PD-L2, (G) TIM-3, (H) 4-1BB, (I) APRIL, (J) BAFF, (K) CD27, (L) CD28, (M) MICB, (N) CD80, (O) IL-2Rα. Each point represents one patient, and the median is shown as a horizontal line. Q-values obtained from performing the original false-discovery rate method of Benjamini–Hochberg are shown as *q < 0.05, **q < 0.01, ***q < 0.001, ****q < 0.0001.

