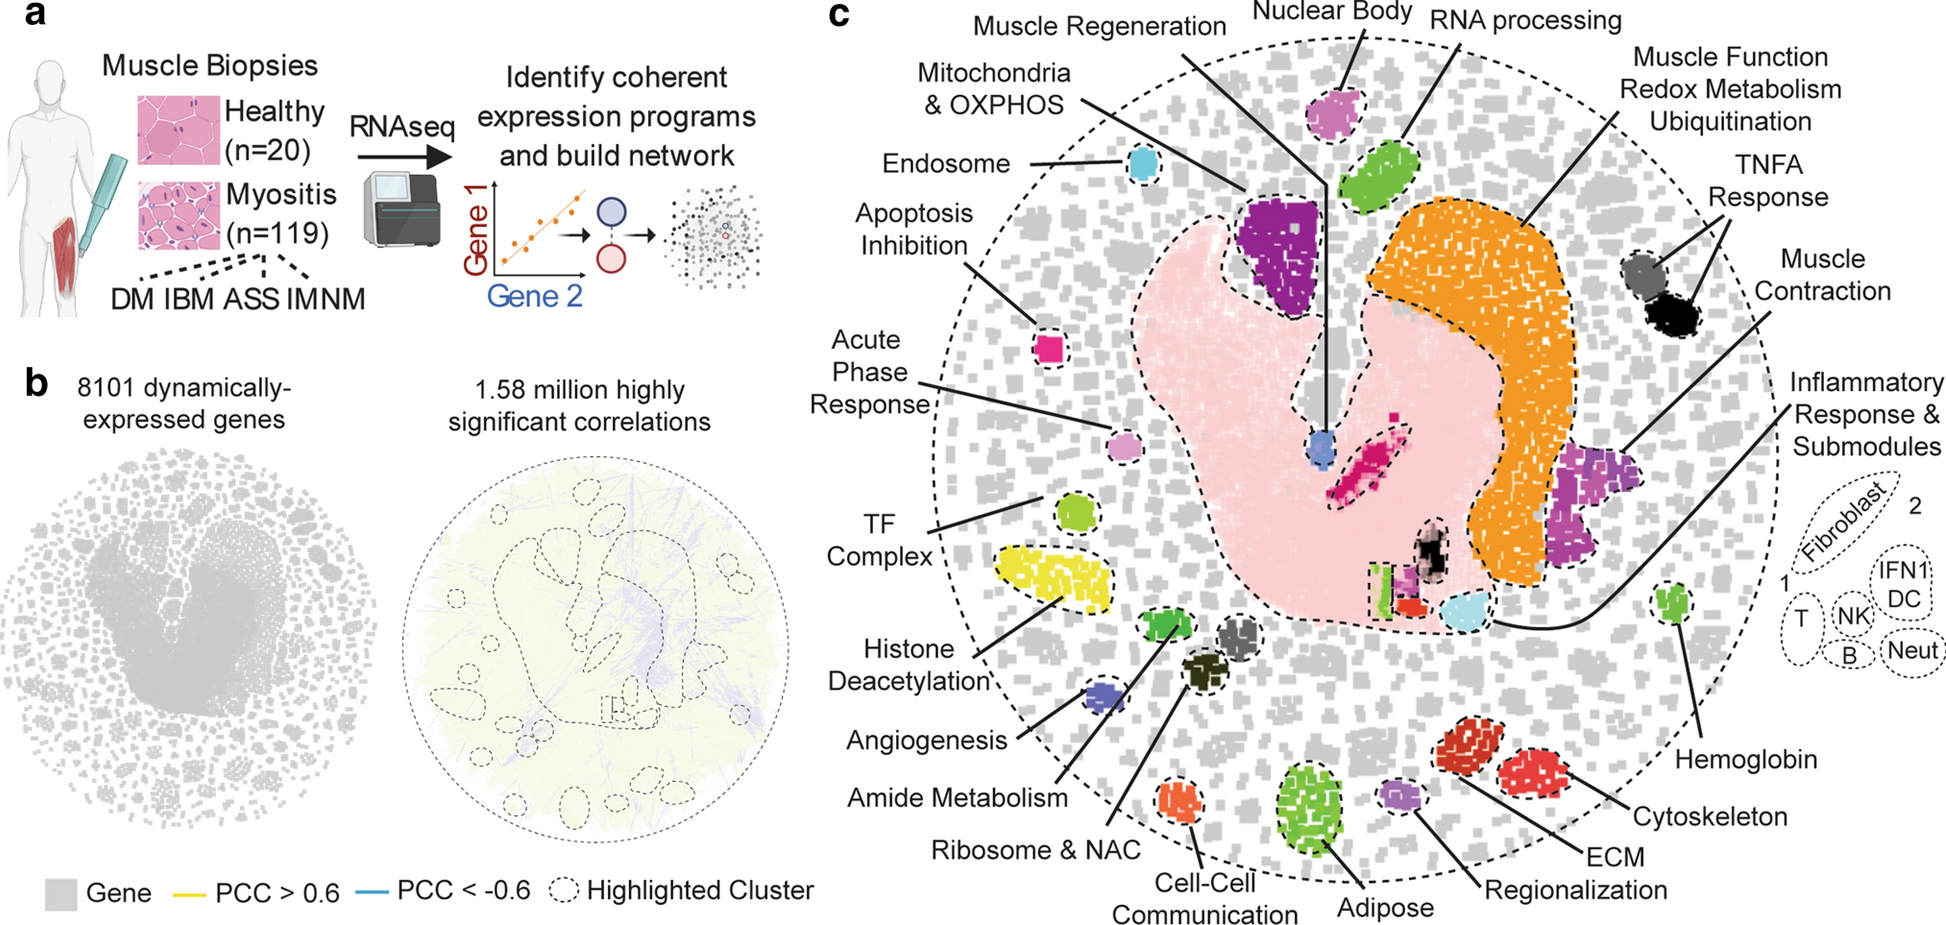
Figure 1: A map of gene expression programs in healthy and diseased skeletal muscle biopsies.

(a) Schematic of approach. (b) A global similarity network of dynamically expressed transcripts in normal or myositis patient biopsies. All Pearson correlation coefficients (PCC) with an absolute magnitude greater than 0.6 are included as unweighted edges. (c) Network modules revealed by Markov clustering, Gene Set Enrichment Analysis, and the imposition of cell-type-specific transcripts.
