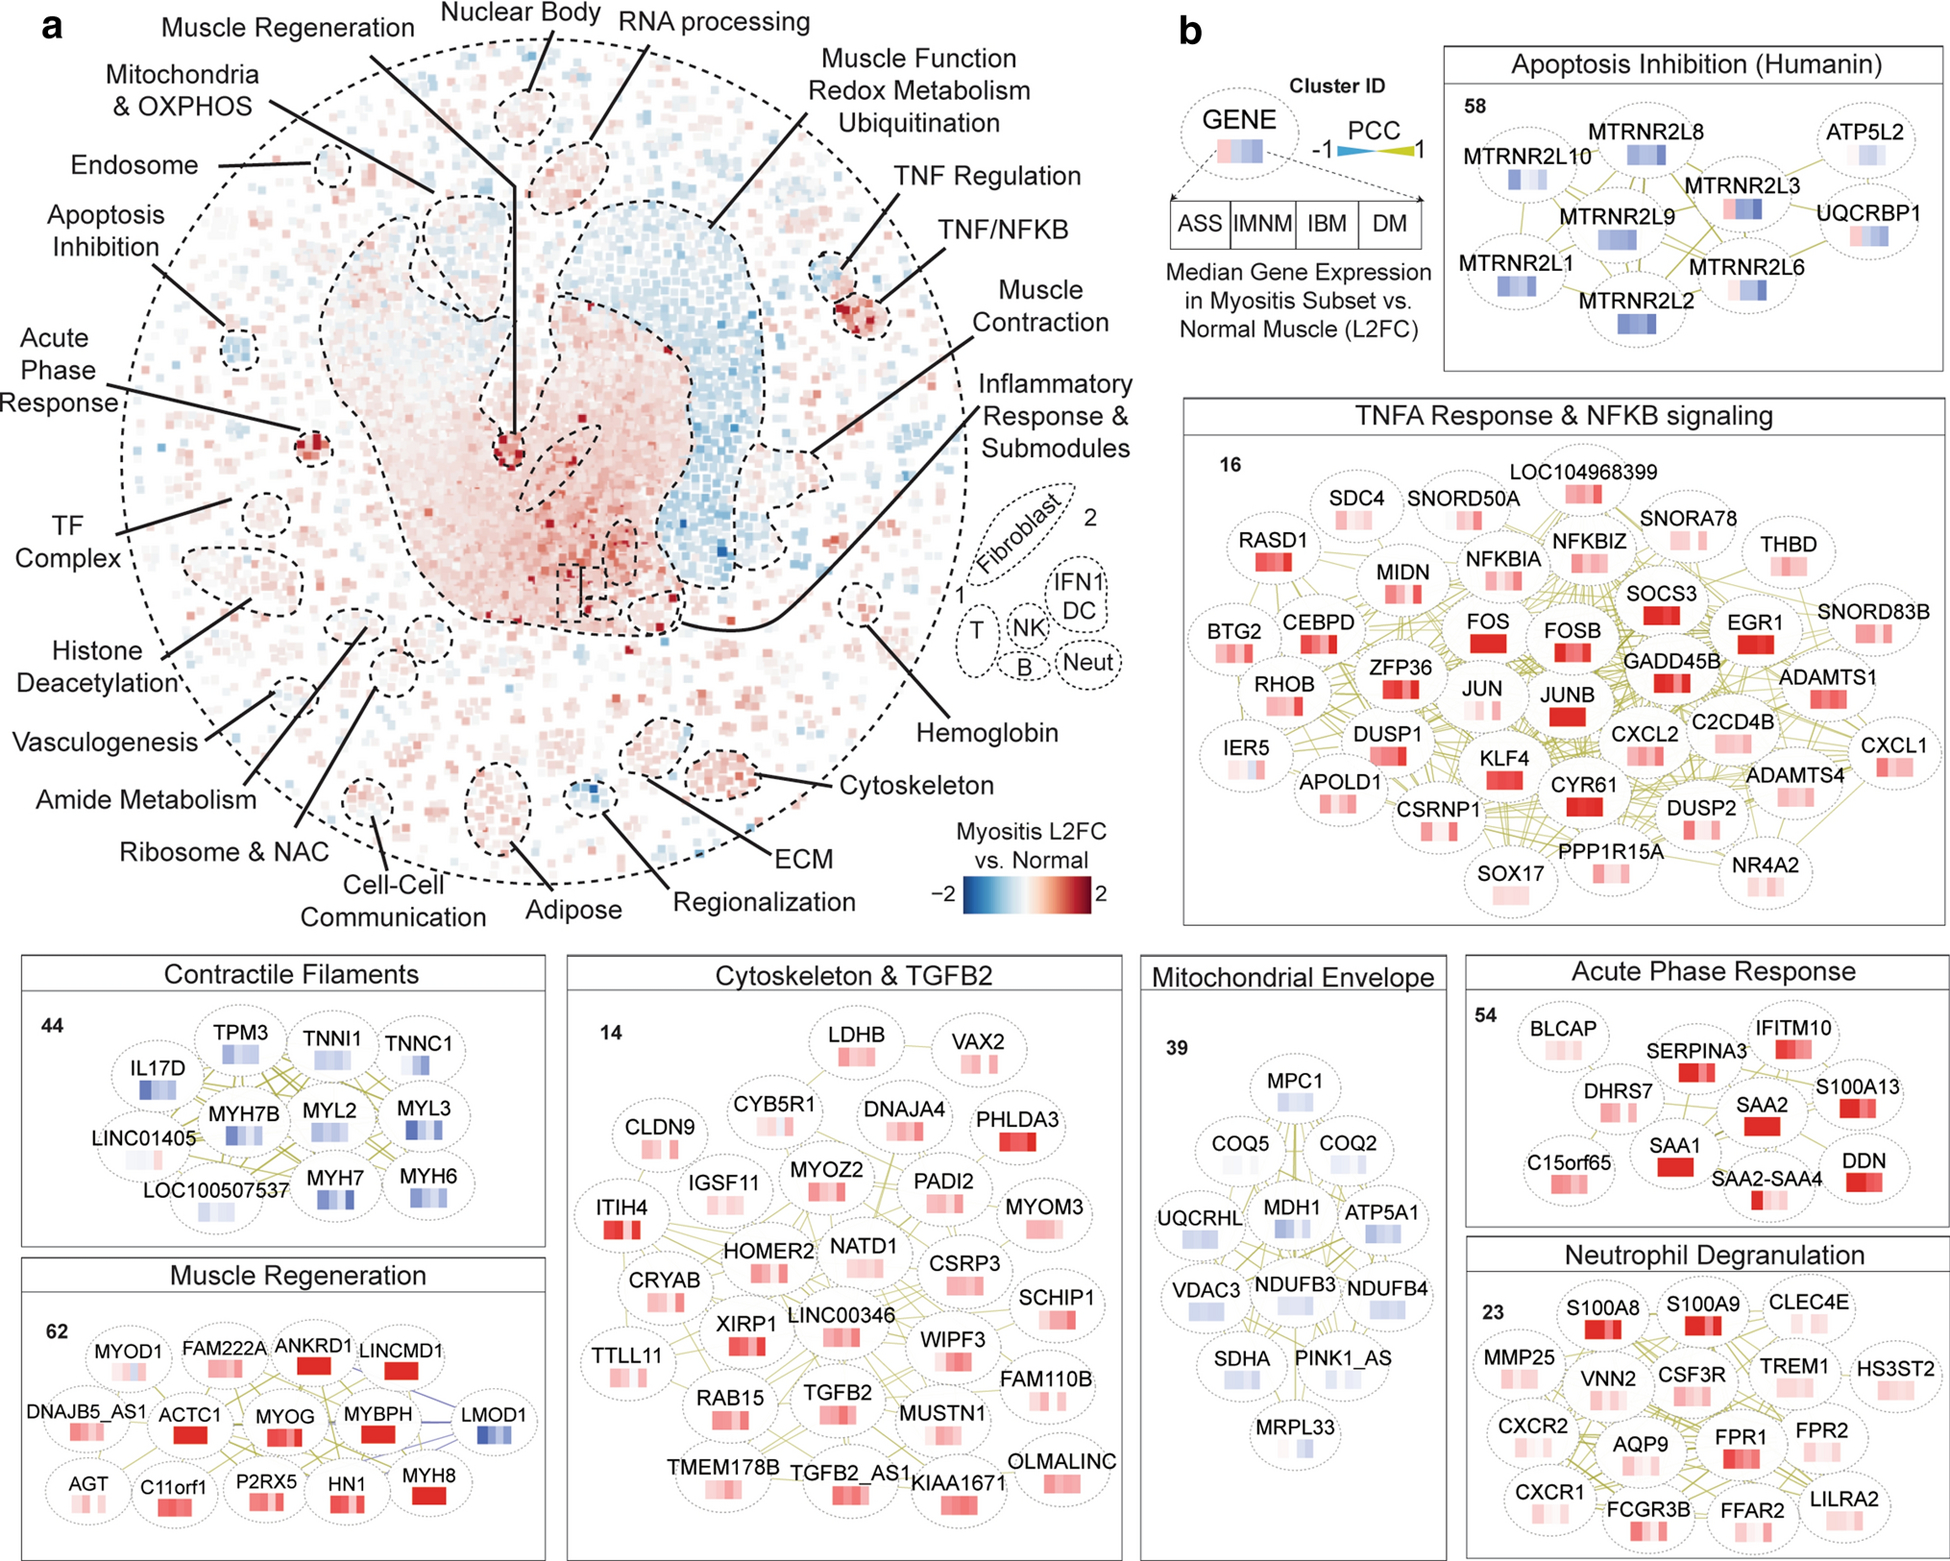
Figure 2: Core gene expression alterations in myositis patients.

(a) Relative expression of network genes in the median myositis patient biopsy as compared with the median normal control patient. Fold changes are as indicated, i.e. red is overexpressed. (b) Example clusters altered similarly across clinical subsets of myositis. Nodes contain a heatmap showing the expression of genes in each major myositis subset; see key. Networks follow a force-directed layout with minimal rearrangements for legibility. For more information on individual clusters (numbered), see Online Resource Supplementary Table 2.
