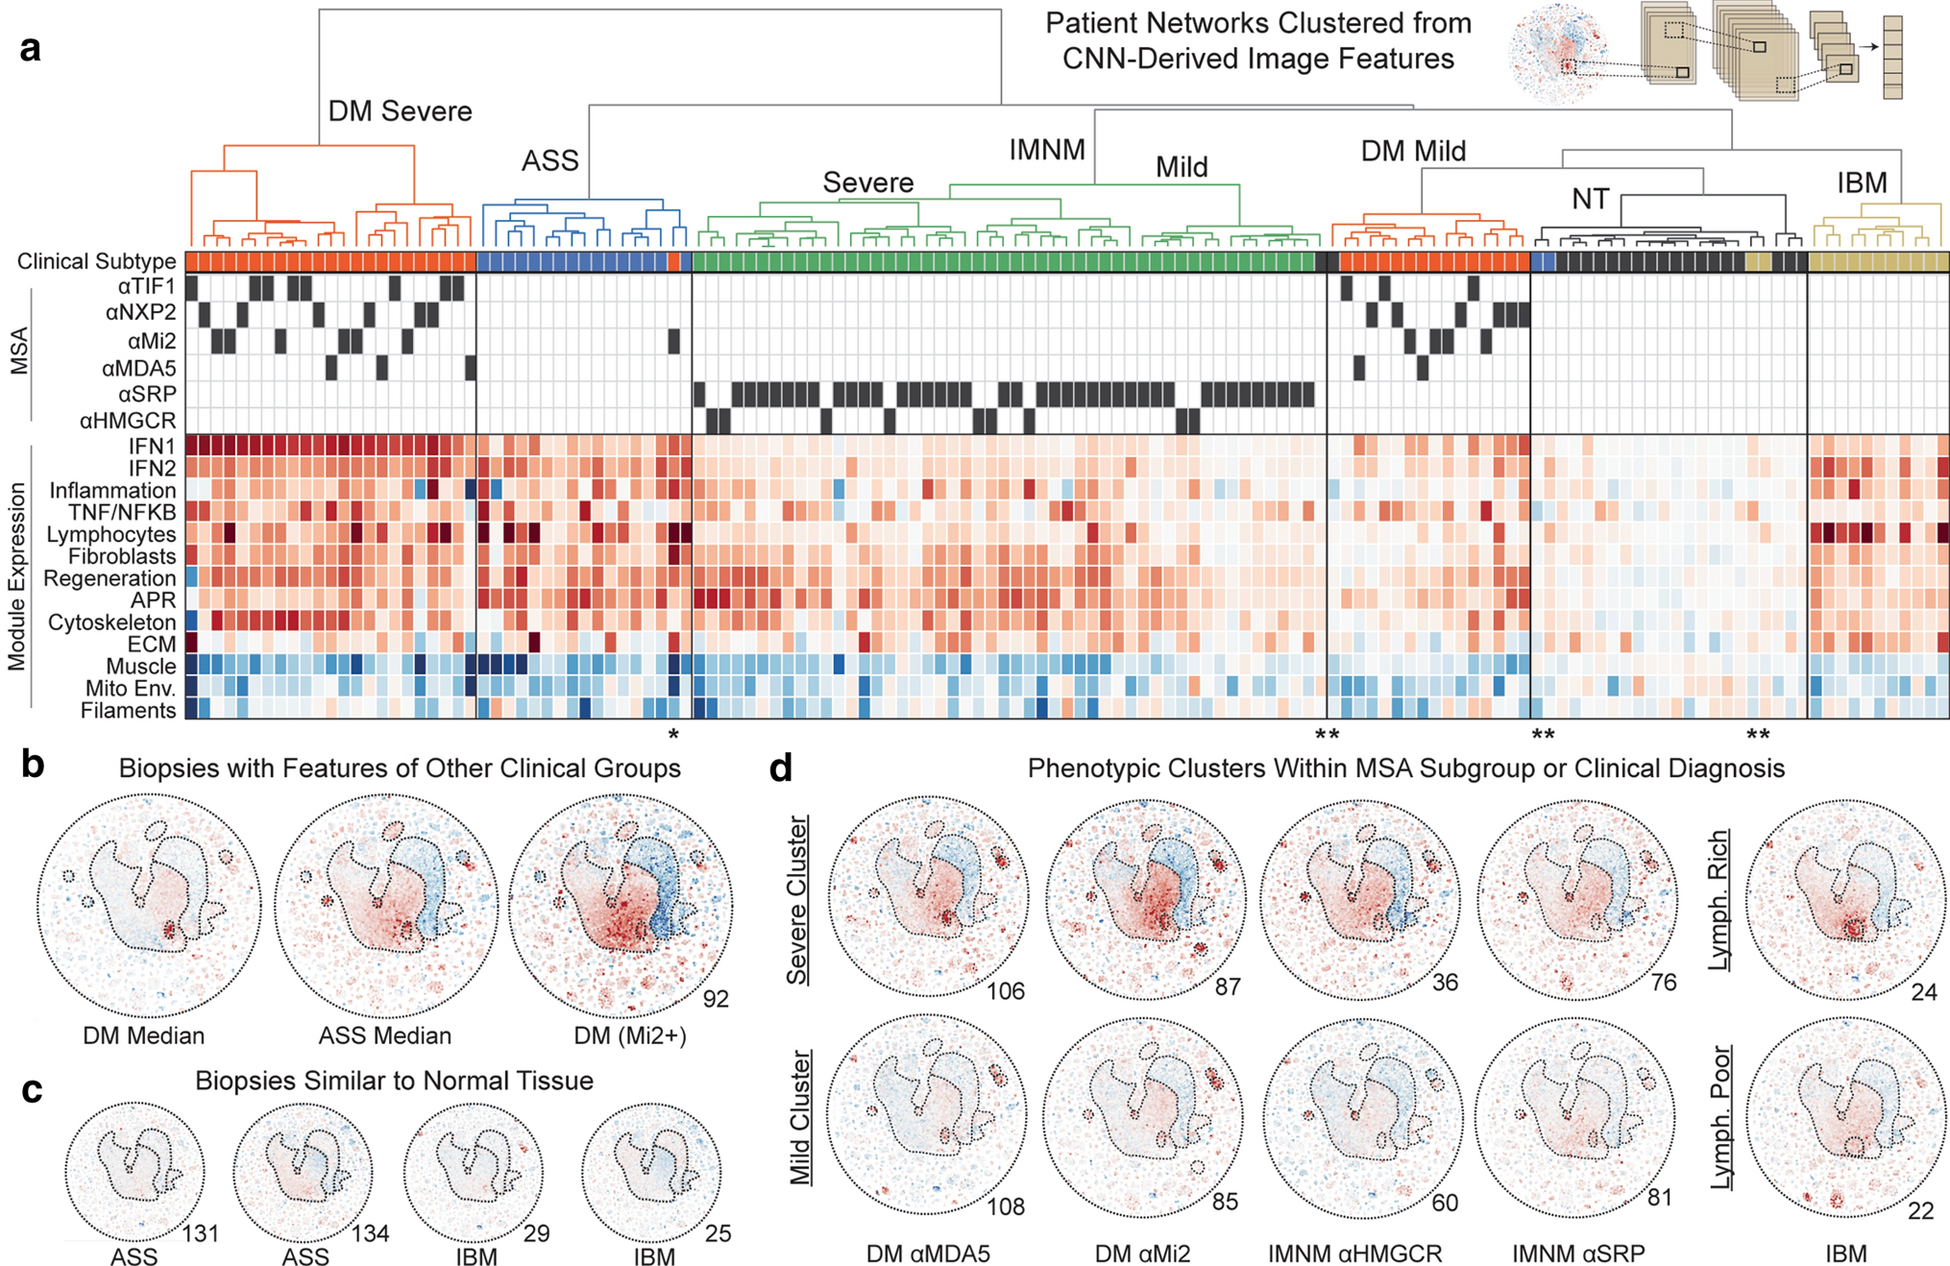
Figure 5: Deep learning organization of patients by their transcriptional network features.

(a) Features, extracted from a convolutional neural network (CNN) trained to classify patients by their network image, were used to hierarchically cluster patients into groups with the least variance. Clinical features and signature scores for dynamic clusters corresponding to known biological processes are shown below the dendrogram. Dark boxes indicate MSA presence. Red/blue indicate overexpression and suppression as in prior figures. (b) An example biopsy from a DM patient which had many features enriched in ASS patients. (c) Four biopsies which had minimal global changes and clustered with normal tissue biopsies. (d) Example phenotypic subsets within clinical or MSA-defined subgroups include patients with delineations by overall severity of transcriptomic rewiring as well as a lymphocyte-rich subset of IBM.
