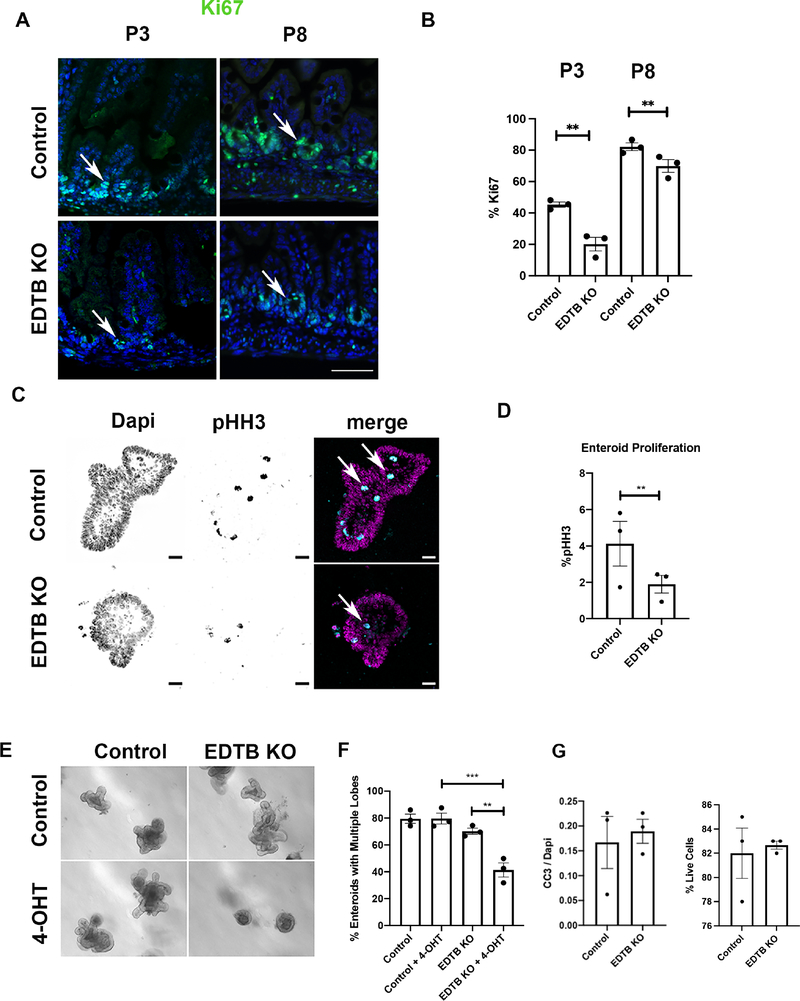
Figure 3. Decreased proliferation after EDTB KO.
(A) P3 and P8 ileum from EDTBfl/fl Cre− (control) and EDTBfl/fl Cre+ (EDTB KO) mice were labeled with antibodies against Ki67 (green) and counterstained with DAPI (blue). Ki67 labels the intervillous in P3 and crypt regions in P8 pups. There is decreased labeling in EDTBfl/fl Cre+ animals (arrows). Scale bar: 50μm. (B) Quantification of Ki67 labeling demonstrates decreased proliferation after EDTB KO (n=3). (C) EDTBfl/fl Cre+ enteroids were grown in the presence or absence of 4-OHT for 48 hours and labeled with antibodies against phospho-histone H3 (pHH3; arrows). pHH3 labels more nuclei in control compared to EDTB KO enteroids. Scale bar: 20μm. (D) Quantification of pHH3 labeling demonstrates decreased proliferation in EDTB KO enteroids (n=3). (E) EDTBfl/fl Cre+ and EDTBfl/fl Cre− enteroids were grown for 6 days in the presence or absence of 4-OHT to induce EDTB KO in vitro. EDTBfl/fl Cre+ enteroids treated with 4-OHT have fewer lobes. There is no reduction in lobes of EDTBfl/fl Cre+ enteroids (Control) without 4-OHT or in EDTBfl/fl Cre− enteroids (KO) treated with 4-OHT. (F) Quantification of enteroid lobe growth (n=3). (G) Enteroids were labeled with antibodies against CC-3 and quantified. There is no difference in CC-3 labeling between control and EDTB KO enteroids (n=3). (H) EDTBfl/fl Cre+ and EDTBfl/fl Cre− enteroids were grown for 48 hours in the presence of 4-OHT, dissociated and incubated with Trypan Blue to assess cell viability. >80% of enteroids in control and EDTB KO samples (n=3). Error bars represent mean +/− SEM. Error bars represent mean +/− SEM, *p<0.05, **p<0.01, ***p<0.005

