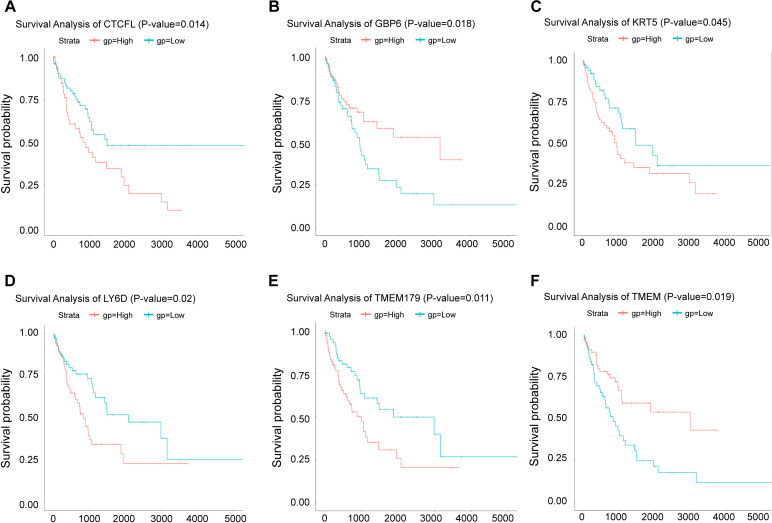
Fig 6. Survival curve of differentially expressed mRNA.
A. Survival curve of CTCFL. B. Survival curve of GBP6. C. Survival curve of KRT5. D. Survival curve of LY6D. E. Survival curve of TMEM. F. Survival curve of TMEM179. The abscissa represented survival time (days), and the ordinate represented survival rate. The blue line represented the low risk curve and the red line represents the high risk curve, p<0.05.

