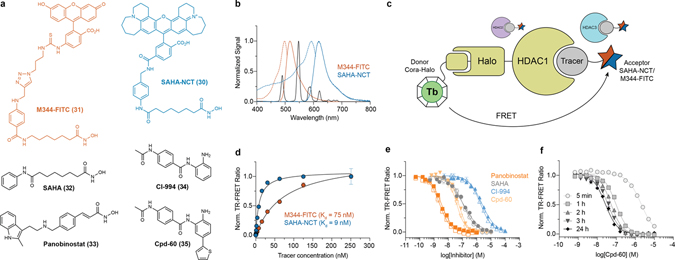
Figure 4. CoraFluor performance in TR-FRET ligand-displacement assays for HDAC1-HaloTag in crude lysate from transiently transfected HEK293T cells.
(a) Structures of HDAC tracers (M344-FITC, SAHA-NCT) and representative HDAC inhibitors (SAHA, panobinostat, CI-994, Cpd-60) used in this study. (b) Spectral overlap of Tb emission (black, solid) with M344-FITC (orange, dashed) and SAHA-NCT (blue, dashed) absorbance, alongside M344-FITC (orange, solid) and SAHA-NCT (blue, solid) emission. (c) Schematic showing the TR-FRET assay principle wherein covalently bound CoraFluor HaloTag-ligands produce specific TR-FRET signal with fluorescent HDAC tracers M344-FITC and SAHA-NCT, which can be depleted by unlabeled HDAC inhibitors. Here, the specific nature of the HaloTag renders this assay format compatible with cell lysates, where binding to HDAC1 can be measured in the direct presence of other HDAC isoforms. (d) Saturation binding of M344-FITC (orange) and SAHA-NCT (blue) to Cora-1-Halo-labeled HDAC1-HT in HEK293T lysate. (e) Dose-response titration of test compounds in HEK293T lysate using M344-FITC (open shapes) or SAHA-NCT (solid shapes) as tracers at concentrations near their respective Kd values. Ki-values obtained with both tracers are virtually identical and match inhibitory constants determined by other assay platforms (see Supplementary Table 2). (f) Kinetic profiling of HDAC1 inhibition by Cpd-60 (tracer: M344-FITC), confirms time-dependent activity and slow-binding kinetics, resulting in > 100-fold differential apparent Ki over the course of 24 h. Data in d-f are presented as mean ± SD (n = 3 technical replicates) and are representative of at least two independent experiments.

