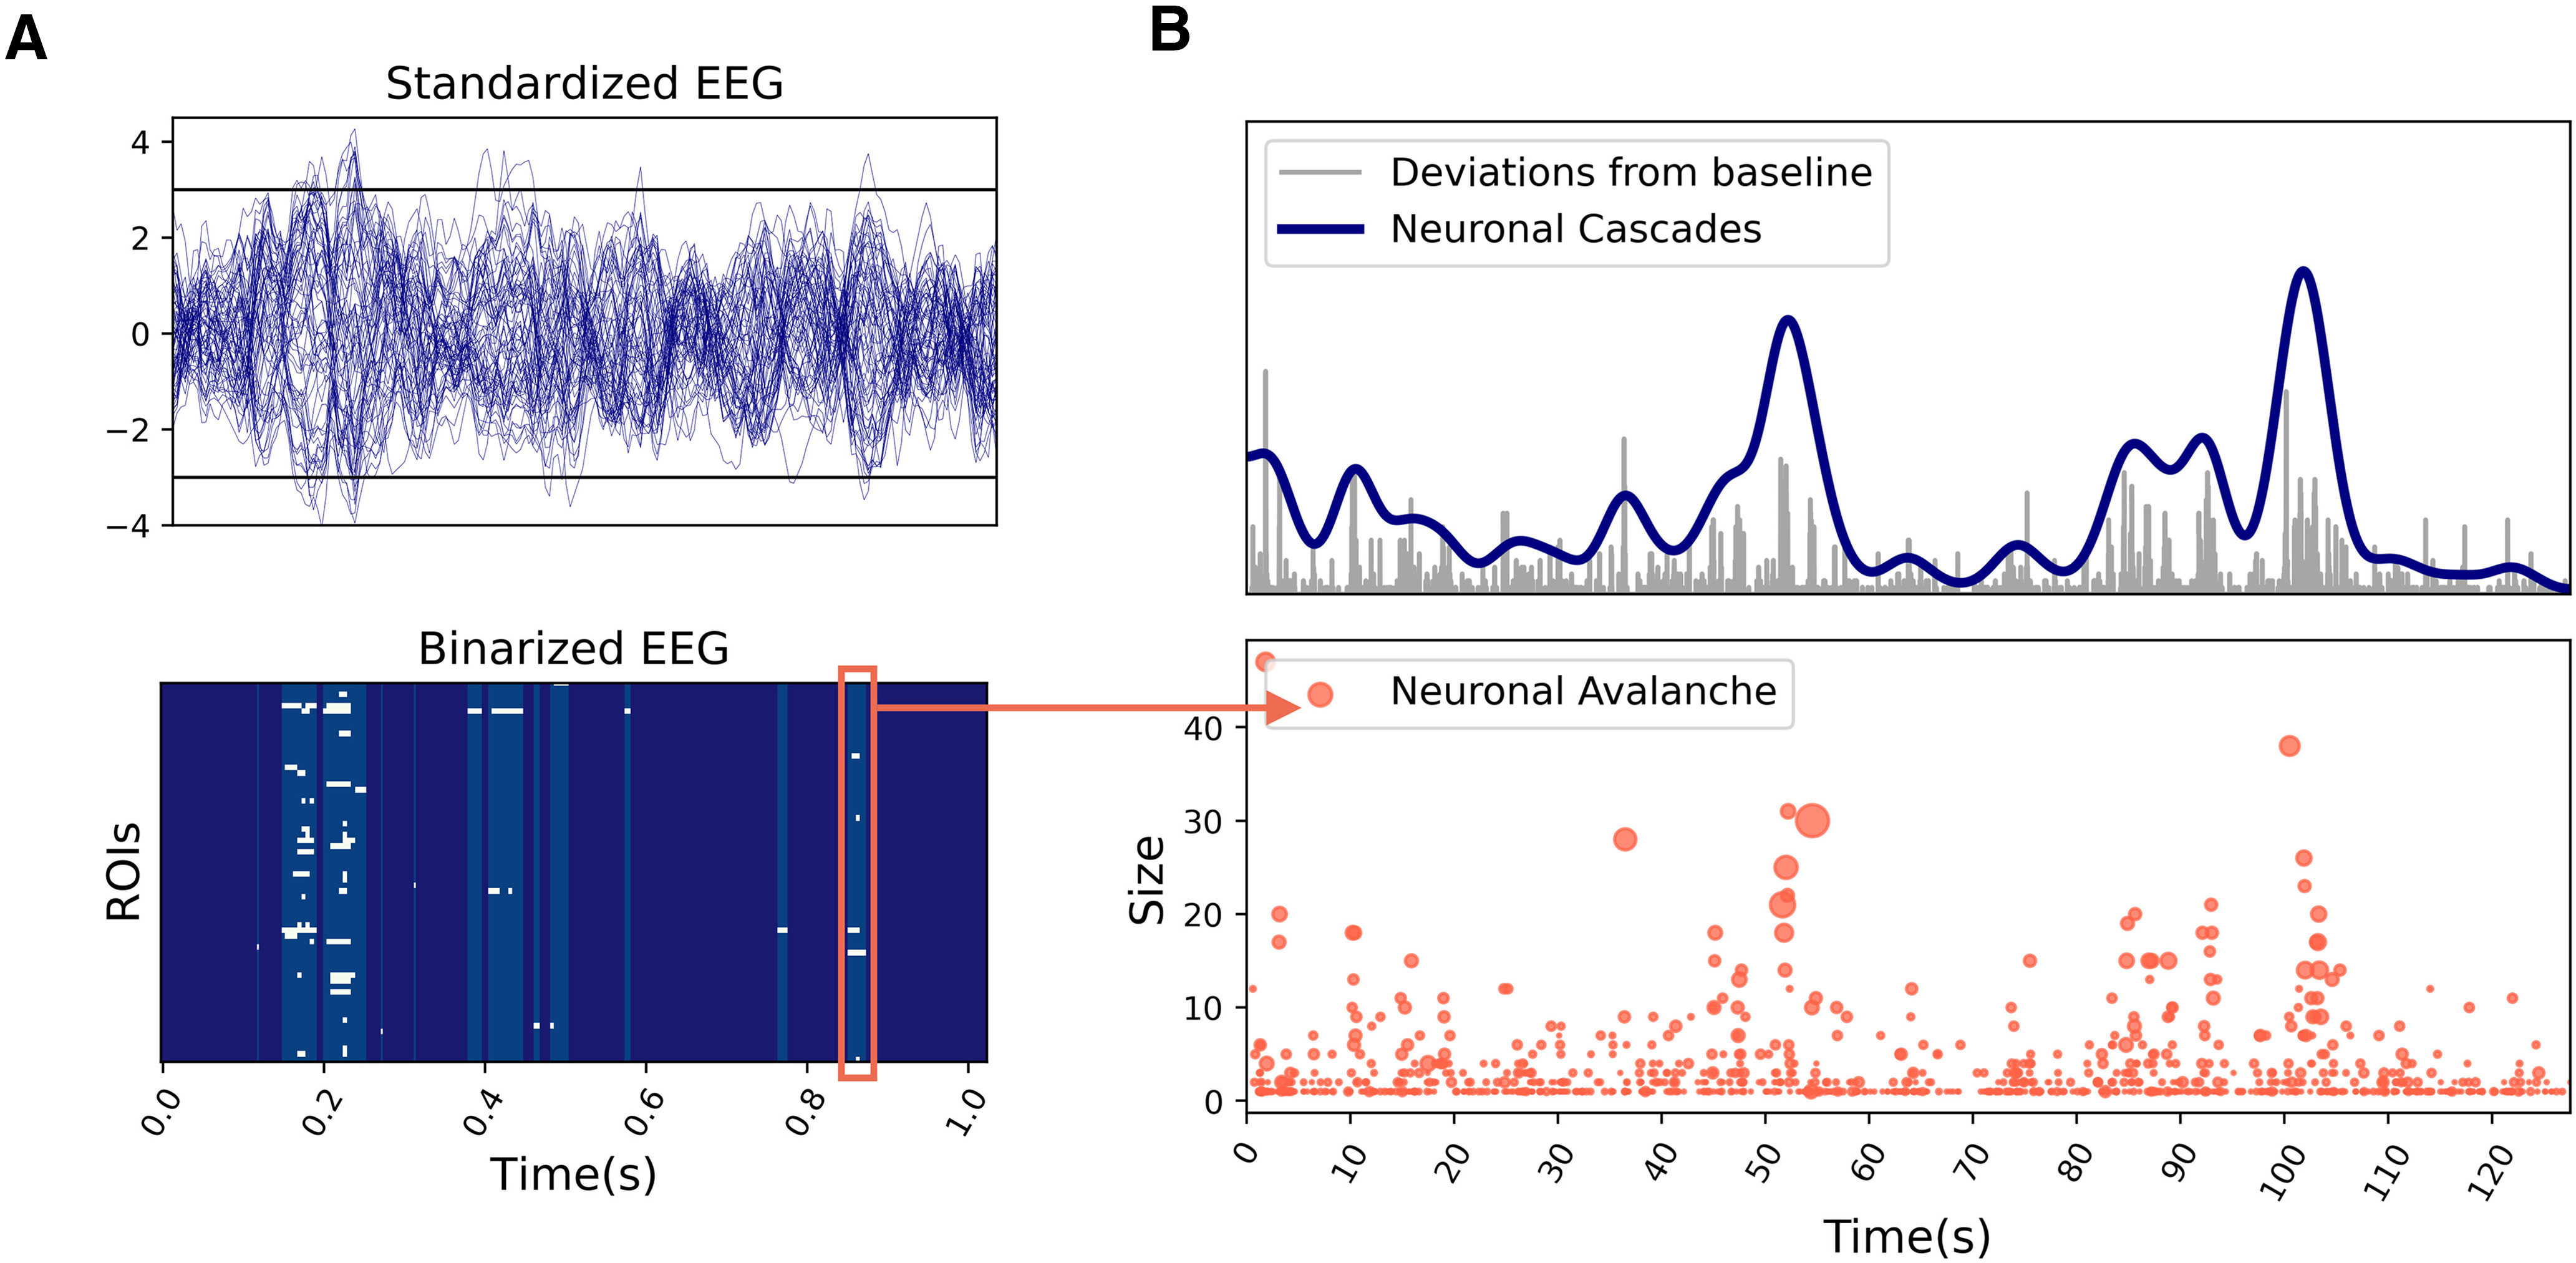
Figure 6.

Neuronal cascades and neuronal avalanches. A, Standardized EEG activity extracted from a resting-state human EEG/fMRI dataset (top). The activity is binarized assigning a unitary/null value every time the activity in a region is above/below a certain threshold (e.g., ±3 σ; black lines). The obtained binary raster plot (bottom) is characterized by intermittent epochs of deviations from baseline activity. Neuronal avalanches are defined as consecutive deviations from baseline activity (e.g., red box). B, We extract the global magnitude of the deviations from baseline (top, gray signal) by summing the binary EEG raster plot over the ROIs. This signal is convoluted with a Gaussian kernel [width = 1 BOLD TR] and downsampled to obtain the same resolution of the BOLD activity, which defines the neuronal cascades signal (blue). Neuronal cascades can be thought of as clustering of high magnitude avalanches, whose occurrence in time is not homogeneous (bottom).
