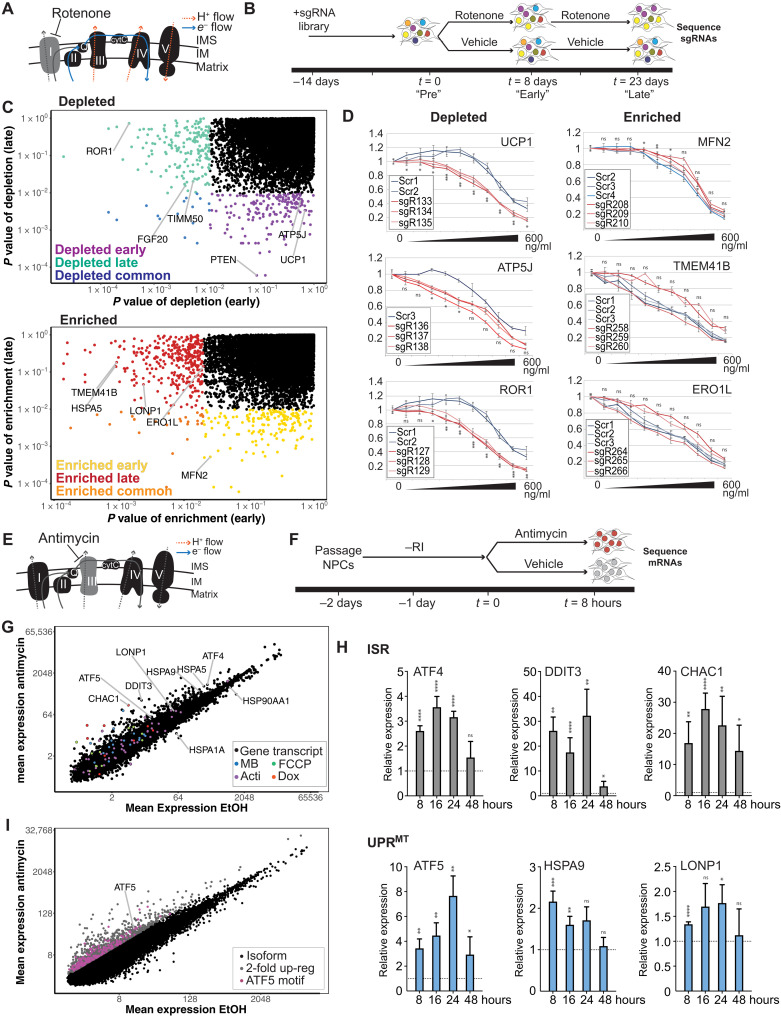
Fig. 1. Cas9 screening and transcriptome analysis to identify critical genes for response to mitochondrial stress.
(A) Model of the effect of rotenone on electron flow through ETC. IM, inner membrane; IMS, inner membrane space; cytC, cytochrome C. (B) Time course of rotenone (3.5 ng/ml) screen: pretreatment (Pre), 8 days (Early), and 23 days (Late). (C) Unadjusted P values associated with depletion (top) or enrichment (bottom) of individual genes. For each graph, x axis shows P value at 8 days (early) and y axis shows P value at 23 days (late). Colored points indicate genes selected for follow-up in C. elegans. (D) Rotenone dose-response survival of cell pools enriched for gene knockouts versus negative controls. X axis: Rotenone concentration in nanograms per milliliter. Y axis: Relative luminescence versus control. ns, not significant. *P < 0.05, **P < 0.01, and ***P < 0.001 using t test versus control. (E) Model of the effect of antimycin on electron flow through ETC. (F) Time course of antimycin (10 μg/ml) transcriptome experiment. Rock inhibitor (“RI”) was removed the day following passaging. (G) Mean expression of individual isoforms [in transcripts per million (TPM)] is plotted. All transcripts up-regulated twofold in (13) are indicated in the specified colors. MB, MitoBLOCK; Acti, actinonin; Dox, doxycycline. (H) Genes from the indicated stress responses [ISR and UPRMT were analyzed by reverse transcription quantitative polymerase chain reaction (RT-qPCR) over the indicated timeline]. Mapped are fold change for two to six biological replicates of antimycin treatment to ethanol (EtOH) treatment with SEM and paired t test. *P < 0.05, **P < 0.01, ***P < 0.001, and ****P < 0.0001. (I) Individual isoforms are plotted. Raw data are found in table S2. All isoforms with twofold up-regulation (gray) were filtered for those with an ATF5 binding motif in the promoter (pink).

