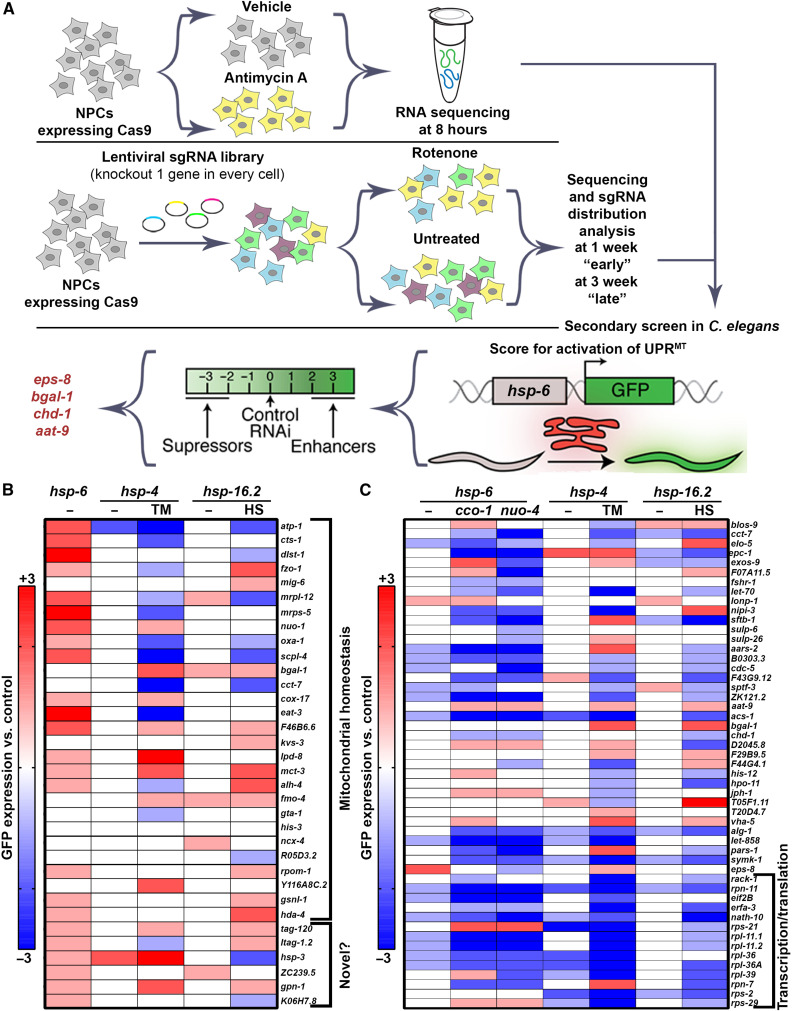
Fig. 2. Secondary screening in C. elegans to identify regulators of cellular stress response.
(A) Schematic of cross-species screening. CRISPR-Cas9 screening and transcriptome analysis were performed in NPCs, and top hits were screened in C. elegans using the UPRMT reporter, hsp-6p::GFP. (B) The top “basal inducers” described as genes that, when knocked down alone, induce UPRMT were rescreened and imaged for effects on hsp-6p::GFP (UPRMT), hsp-4p::GFP (UPRER), and hsp-16.2p::GFP (HSR) induction. Increased or decreased expression of UPRMT, UPRER, or HSR are scored on an integer scale from −3 to +3 compared to controls. For basal induction, animals grown on empty vector control and left untreated serve as a 0 level control. For stress induction, animals grown on empty vector control and treated with specified stress (TM, tunicamycin; HS, heat shock) serve as a 0 level control. Blue indicates decreased expression, and red indicates increased expression. All numerical data can be found in table S5, and all images can be found in the Supplementary Materials. (C) The top “suppressors” described as genes that when knocked down decreased induction of UPRMT under stress via either cco-1 or nuo-4 knockdown were rescreened and imaged for effects on hsp-6p::GFP (UPRMT), hsp-4p::GFP (UPRER), and hsp-16.2p::GFP (HSR) induction. Increased or decreased expression of UPRMT, UPRER, or HSR are scored on an integer scale from −3 to +3 compared to controls. For basal induction, animals grown on empty vector control and left untreated serve as a 0 level control. For stress induction, animals grown on empty vector control and treated with specified stress (20% cco-1 or nuo-4 RNAi) serve as a 0 level control. Blue indicates decreased expression and red indicates increased expression. All numerical data can be found in table S6, and all images can be found in the Supplementary Materials.

