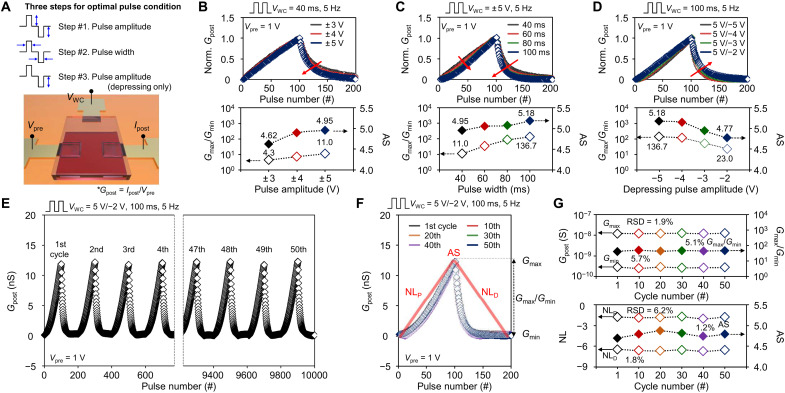
Fig. 3. Controllability and electrical stability of dynamic characteristics.
(A) Schematic illustration of the SIZO/ion gel synaptic device showing an application of the Vpre and VWC, where the VWC was varied according to three steps: step #1, the potentiating and depressing pulse amplitude variations from ±3 to ±5 V; step #2, the pulse width variations from 40 to 100 ms; and step #3, the depressing pulse amplitude variations from −5 to −2 V. (B to D) Normalized LTP/D characteristic curves according to the pulse number (top panel) and the extracted Gmax/Gmin and AS from the curves (bottom panel) corresponding to steps #1 to #3. (E) Electrical stability analysis of the dynamic characteristics with the optimal pulse condition (VWC = +5/−2 V, 100 ms, 5 Hz). For the cycle test, a set of VWC pulses consisting of 100 potentiating and 100 depressing pulses was applied to TWC repeatedly 50 times (a total of 10,000 pulses). (F) Extracted LTP/D characteristic curves for the first cycle and every 10th cycle from 10th to 50th. (G) Extracted Gmax/Gmin and AS from the six LTP/D characteristic curves.

