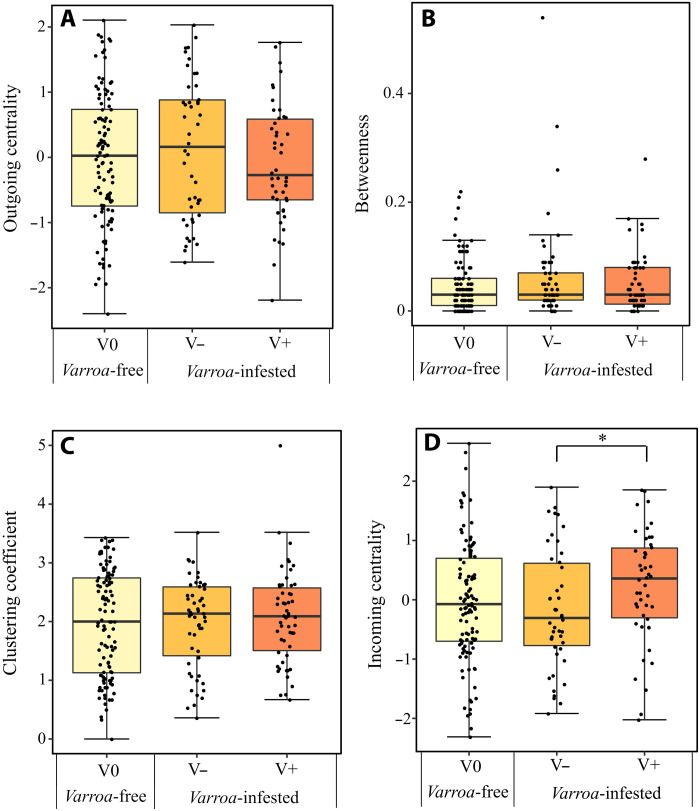
Fig. 10. Social network parameters.
Comparison of centrality measures, i.e., outgoing centrality (A), betweenness (B), clustering coefficient (C), and incoming centrality (D), among unparasitized (V0) individuals in Varroa-free groups and unparasitized (V−) and parasitized (V+) individuals in Varroa-infested groups. Box plots represent the median (line), quartiles (box), and extreme values (no greater than 1.5 times the interquartile range, whiskers). *P < 0.05.

