
Figure 2. Co-inoculation with G. vaginalis results in increased GBS invasive ascending infection.
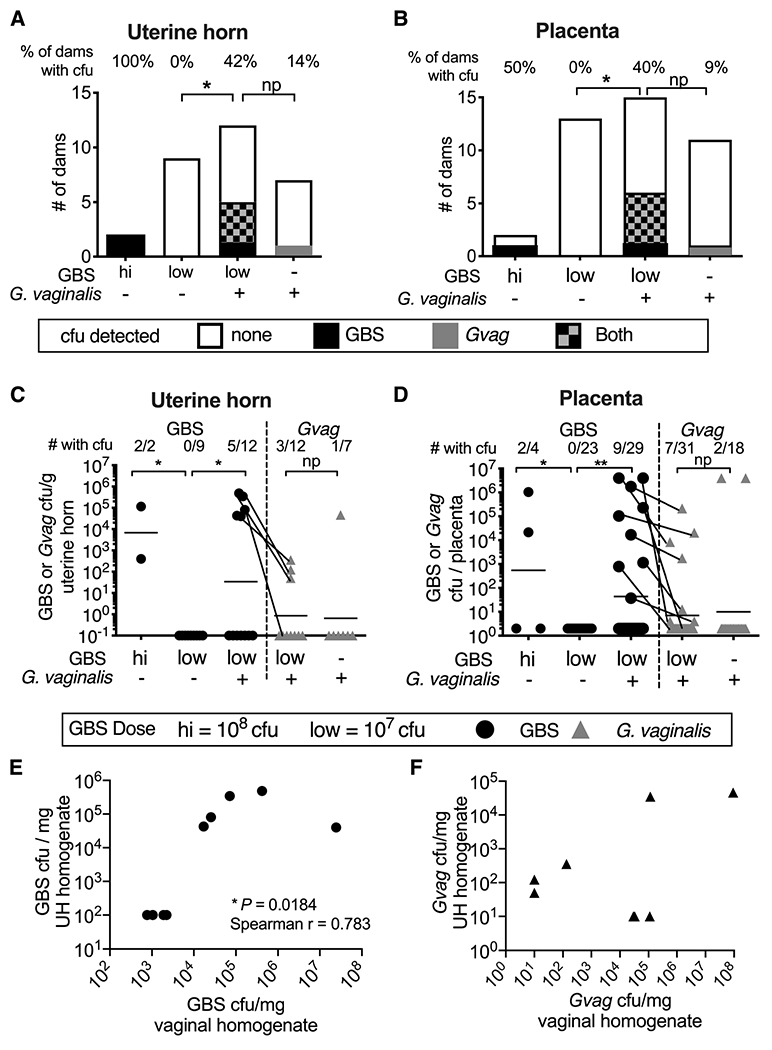
(A-B) Number of dams without or with bacterial cfu in uterine horn (A) or placental (B) tissue homogenates. Percentage of dams with detectable cfu indicated across the top of each bar. Fisher’s exact test *P < 0.05; np = not powered. (C) Bacterial titers in uterine tissue homogenates. The fraction of dams with detectable cfu is indicated across the top of the graph. 11 independent experiments. Uterine tissue was not collected from every dam, therefore, data are from a subset of animals included in Figure 1. (D) Bacterial cfu in placental homogenates. The fraction of placentas with detectable cfu is indicated across the top of the graph. 13 independent experiments. (C-D) Bars denote geometric mean. Data points for GBS (circles) and G. vaginalis (triangles) cfu from the same tissues are connected with lines. Mann-Whitney ** P < 0.01; * P < 0.05; ns= not significant. Mann-Whitney test comparing G. vaginalis titers in placentas from mono vs. co-inoculated dams was 0.07 if the two outliers were excluded from the analysis. (E-F) Correlation of GBS (E) and G. vaginalis (F) cfu in uterine horn (UH) and vaginal homogenates.