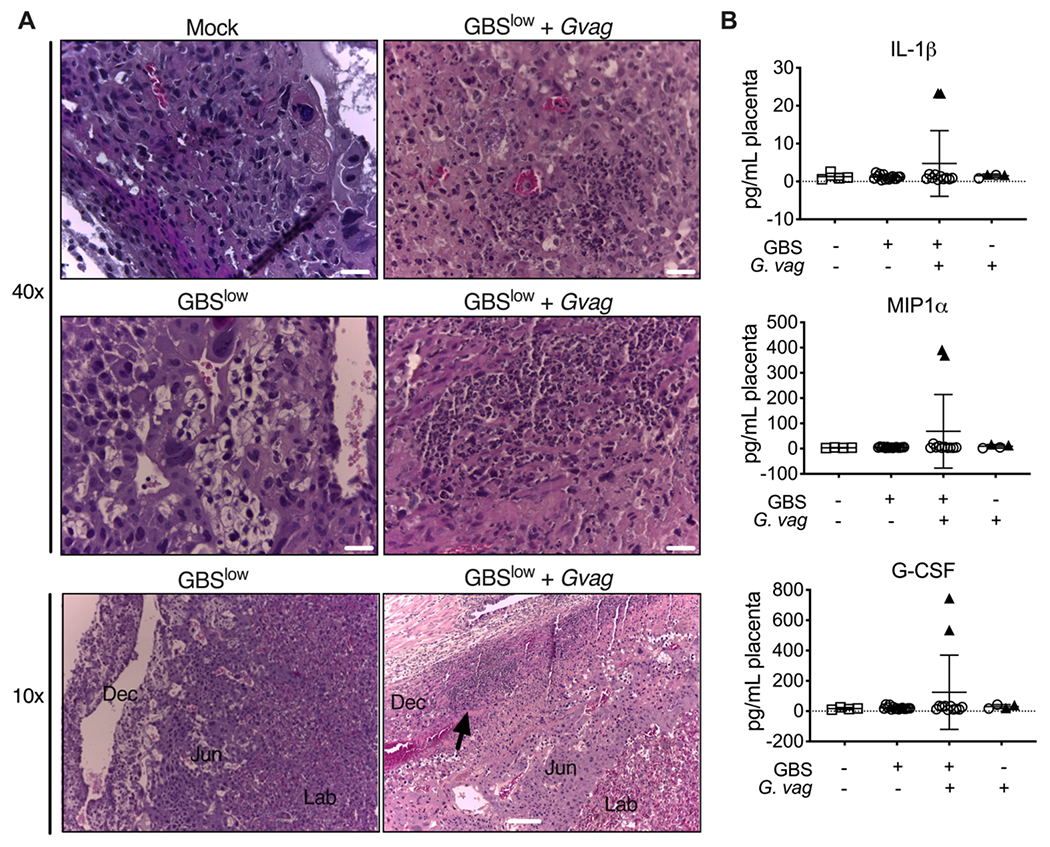
Figure 4. Placental inflammation is evident in co-inoculated dams with detectable GBS placental infection.

(A) H&E staining reveals prolific PMNs, cell debris and monocytes in the decidual compartment by the junctional zone (black arrow) in placentas from the GBSlow+Gvag dams that had detectable infection. Dec = decidua; Jun = junctional zone; Lab = labryinth. Scale bars 20 μm (top 40x images) and 100 μm (bottom 10x images). (B) Cytokine/chemokine levels in placenta homogenates. Black triangles denote placentas that had detectable bacterial cfu.
