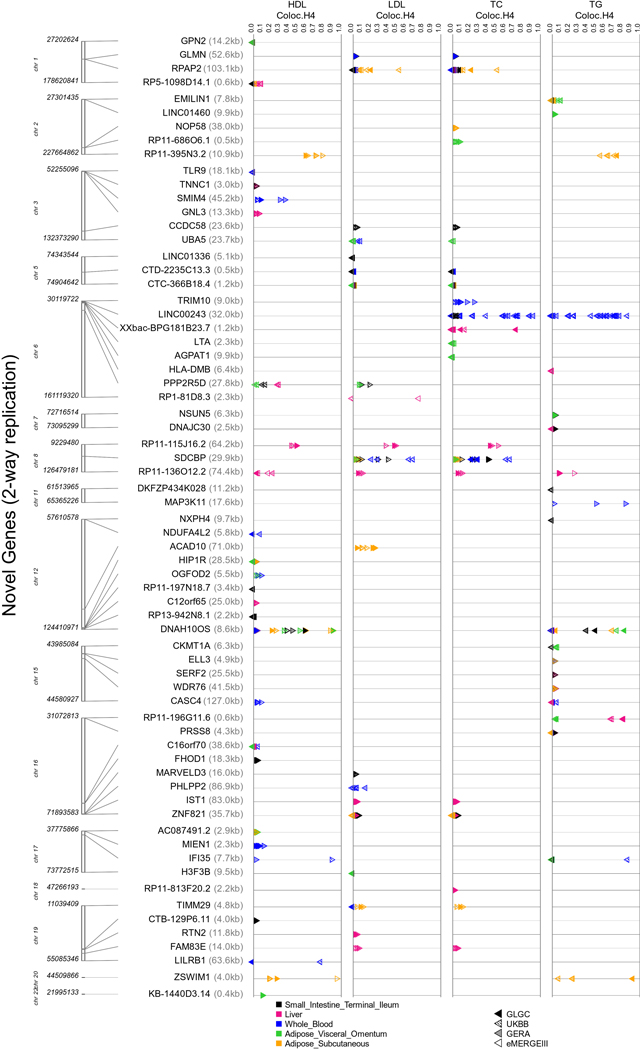
Extended Data Fig. 5. Colocalization probabilities of shared causal variant between lipids and gene expression for novel lipid genes.
Synthesis-view plot indicating coloc P[H4] for Bonferroni-significant “novel” genes (two-sided gene-based tests: P < 5.57 × 10⁻⁷) obtained from lipid TWAS. These genes passed coloc P[H3] < 0.5 filter in at least one cohort. The direction of triangle corresponds to the direction of gene-effect from TWAS (left facing-negative and right facing-positive). Colors indicate the five selected tissues from GTEx v8 (adipose subcutaneous, adipose visceral omentum, liver, small intestine terminal ileum, whole blood). We present coloc results for all regions corresponding to a gene.

