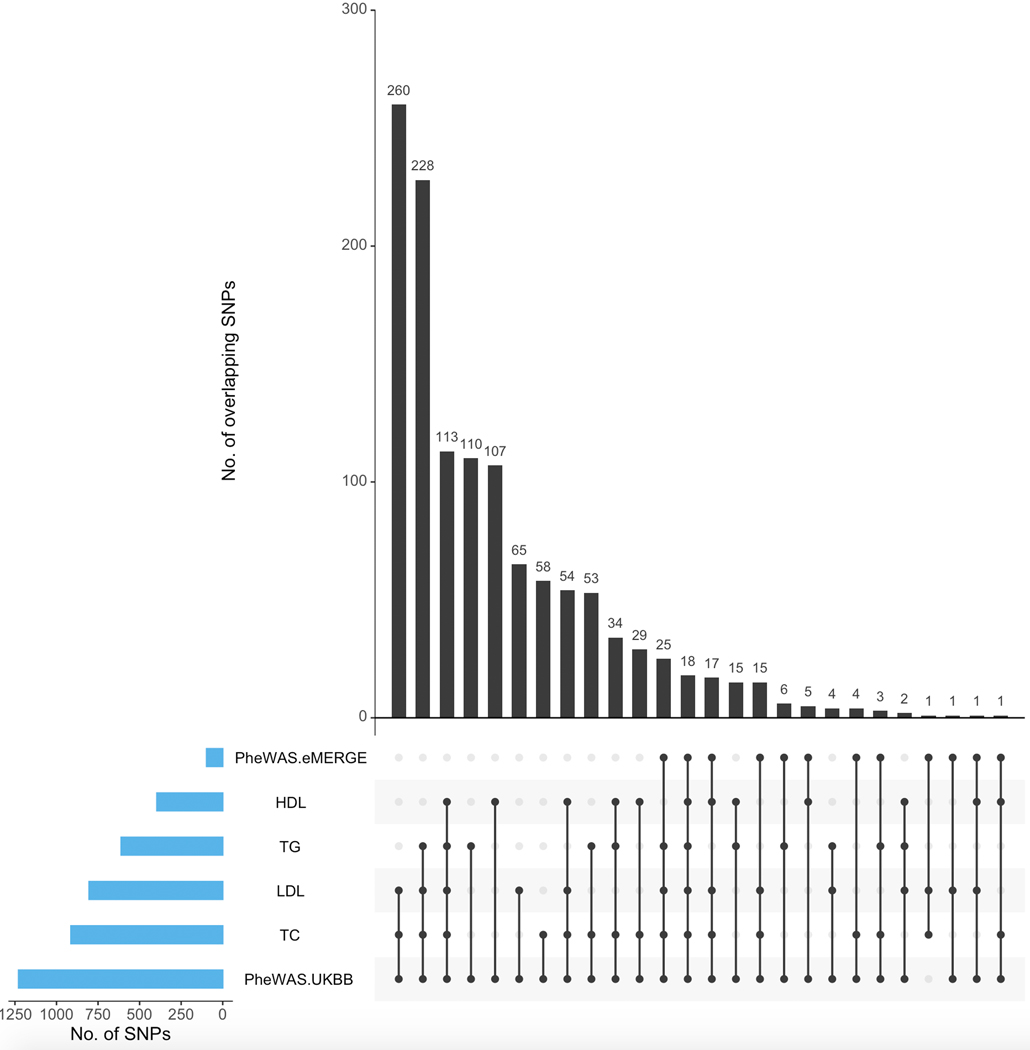
Extended Data Fig. 7. Overlap of significant SNPs between lipid GWAS and lipid-guided PheWAS across cohorts.
UpSet plot indicating overlap of GWAS-significant SNPs (Bonferroni threshold) between each of the four plasma lipids (HDL-C, LDL-C, TC, TG) aggregated across the four considered cohorts (eMERGE, GERA, GLGC, UKB) and lipid-guided PheWAS conducted in eMERGE and UKB, respectively.

