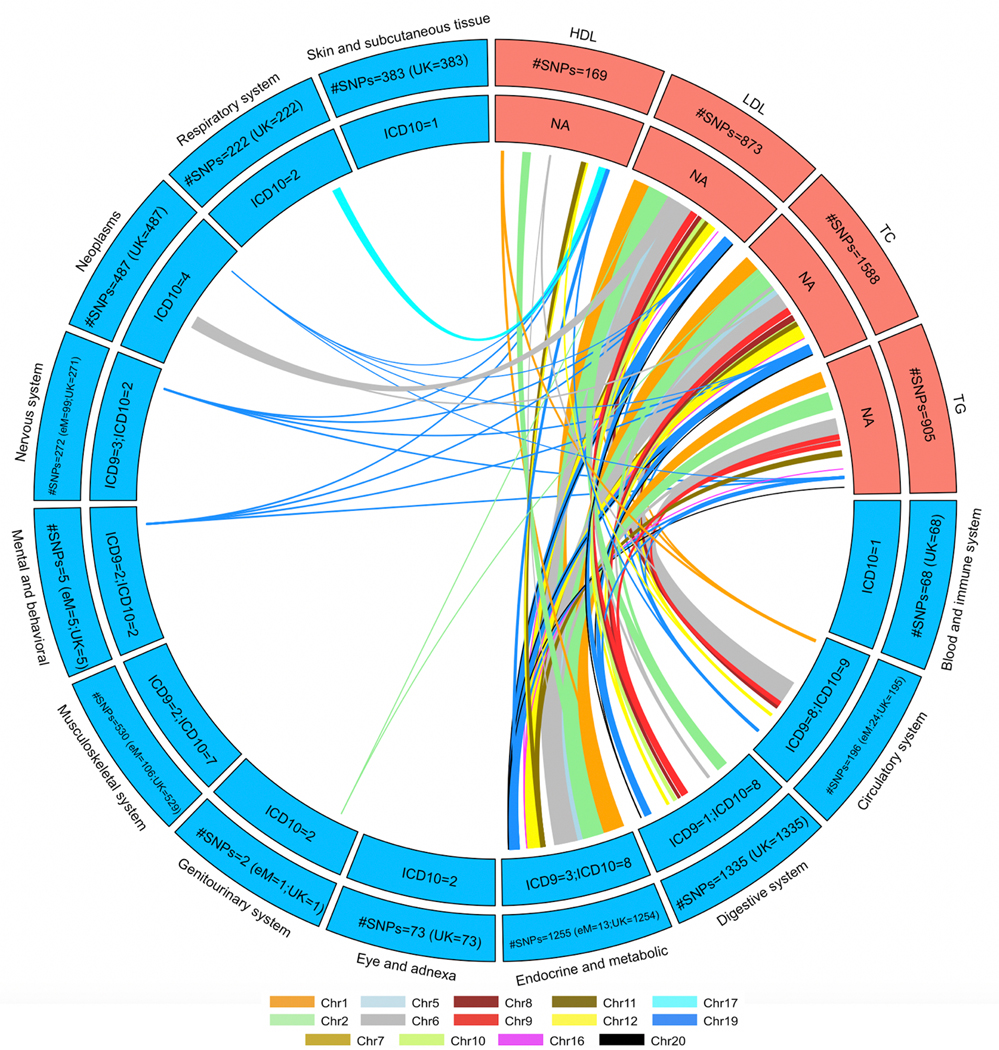
Extended Data Fig. 8. Lipid-disease pleiotropy from lipid-guided PheWAS in either eMERGE or UKB.
Circos plot indicates Bonferroni-significant SNPs in either cohort (eMERGE or UKB) from lipid-guided PheWAS (two-sided logistic regression). Outer track, the number of SNPs detected in either cohort; inner track, significant ICD codes per disease category. Links, SNPs connecting lipids (in salmon) to diseases (in blue); link thickness, # SNPs; link color, chromosome. Due to large number of SNP associations involved, this plot does not show associations (links) in the HLA region (chromosome 6).

