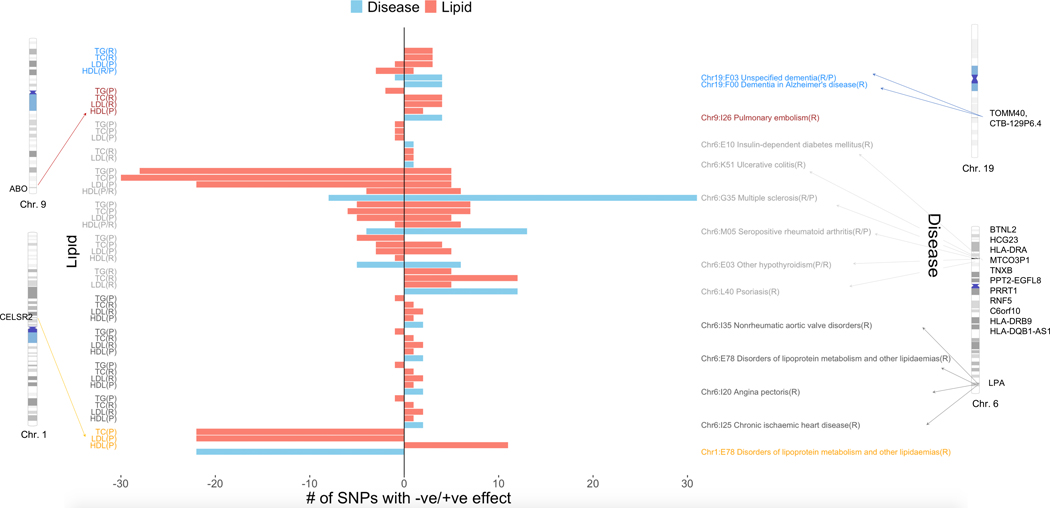
Figure 5 |. Concordant/discordant pleiotropy for SNPs that replicate in both eMERGE and UKB for the same lipids/diseases.
Left-hand side y-axis corresponds to lipids whereas right-hand side y-axis corresponds to the diseases. The x-axis corresponds to number of SNPs with net positive vs. negative effect sizes from lipid GWAS (two-sided linear regression) and lipid-guided PheWAS (two-sided logistic regression). We have also shown the chromosomes and base pair positions corresponding to the replicating SNPs on chromosomes 1, 6, 9 and 19. The disease-lipid associations corresponding to different chromosomes are indicated in different colors (blue, chr. 19; maroon, chr. 9; dark gray, chr. 6 HLA region; light gray, chr. 6 LPA region; orange, chr. 1).

