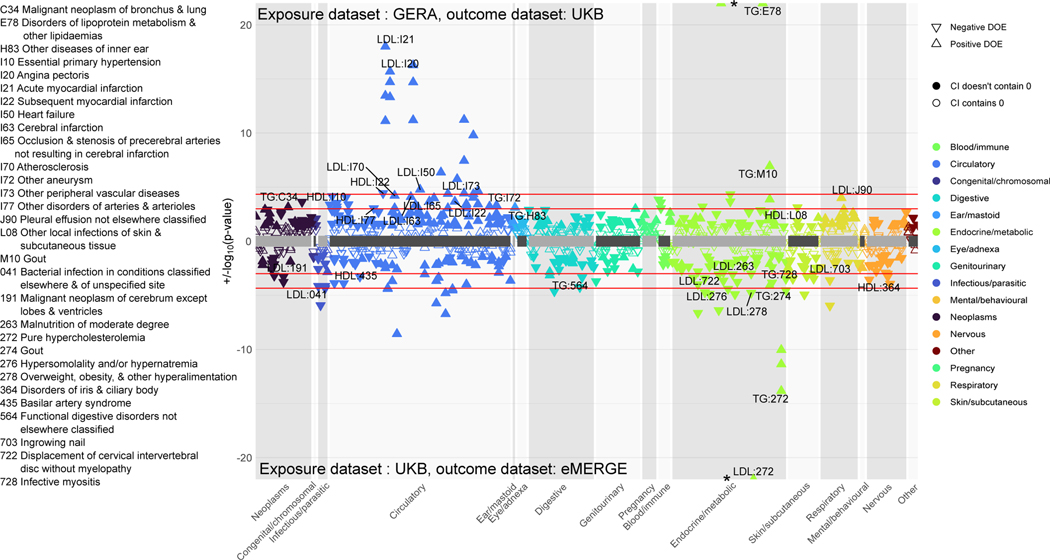
Figure 7 |. Two-sample univariable Mendelian randomization.
Top panel: exposure dataset is GERA and outcome dataset is UKB. Bottom panel: exposure dataset is UKB and outcome dataset is eMERGE. The diseases are grouped into different categories; direction of triangle corresponds to direction of MR effect. In each panel, the two red horizontal lines correspond to the Bonferroni and FDR thresholds. We label FDR-significant ICD codes from at least one of three two-sided tests (inverse-variance weighted, Egger, and median-based) with Egger pleiotropy (intercept) P > 0.05 to have evidence of minimal heterogeneity. Filled points have confidence intervals that do not contain 0 whereas non-filled points have confidence intervals that contain 0.

