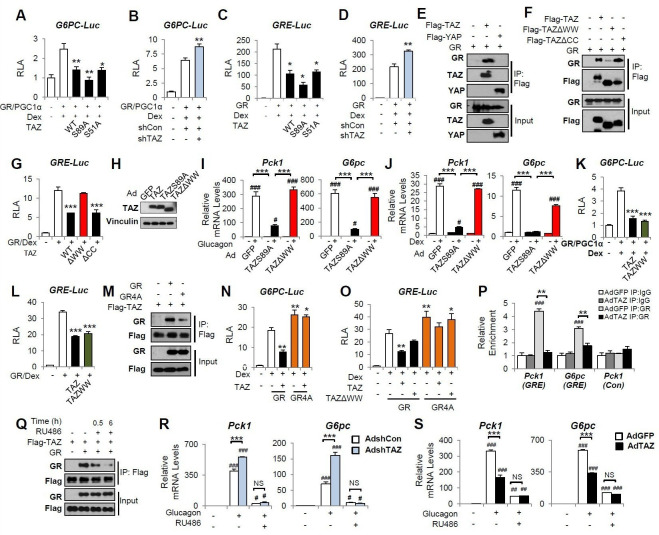
Figure 5. TAZ interacts with glucocorticoid receptor (GR) and inhibits the transactivation of gluconeogenic genes by GR.
(A–D, G, K, L, N, O) HepG2 cells were co-transfected with expression vectors, luciferase reporters, and an internal control (Renilla), and treated with dexamethasone (Dex; 100 nM), as indicated. Relative luciferase activity (RLA) is presented after normalization to the Renilla activity. (E, F, M, Q) 293A cells were transfected with expression vectors, which was followed by immunoprecipitation and immunoblotting, as indicated. (H–J, R, S) Primary mouse hepatocytes were infected with adenoviruses, with or without glucagon or Dex treatment. (R, S) Cells were treated with RU486 30 min prior to glucagon treatment. Protein levels (H) and gene expression (I, J, R, S) were measured by immunoblotting and real-time RT-PCR, respectively. (P) Chromatin immunoprecipitation (ChIP) assays were performed using an anti-GR antibody or a control IgG. The relative enrichment of GR was assessed using real-time RT-PCR, and primers for the indicated regions of the Pck1 and G6pc genes were performed using an anti-GR antibody or a control IgG. Data are means and SEMs of three or four wells or immunoprecipitation reactions. Representative results of 2–5 independent experiments are shown. Data were analyzed by one-way ANOVA (A–D, G, K, L, N, O) and two-way ANOVA (I, J, P, R, S). *p<0.05, **p<0.01, ***p<0.001, #p<0.05, ##p<0.01, ###p<0.001. In (A–D, G, K, L, N, O), * denotes comparisons with wells treated with GR/Dex or GR/PGC1α/Dex alone; in (I, J R, S), # denotes comparisons with controls administered the same viruses; in (P), # denotes a comparison with IgG.
Figure 5—figure supplement 1. TAZ inhibits PCK-Luc activity.

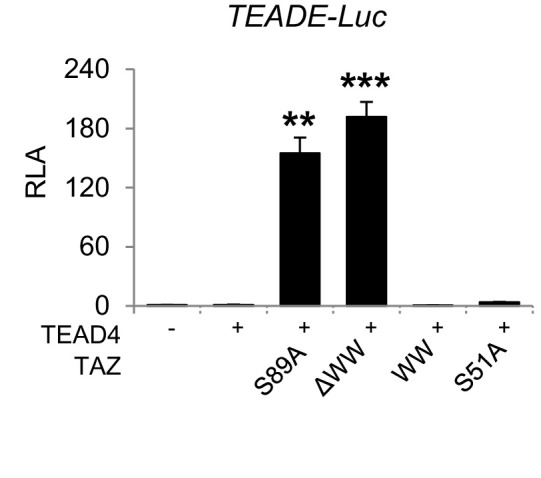
Figure 5—figure supplement 2. Effects of TAZ mutants on TEAD transactivation.

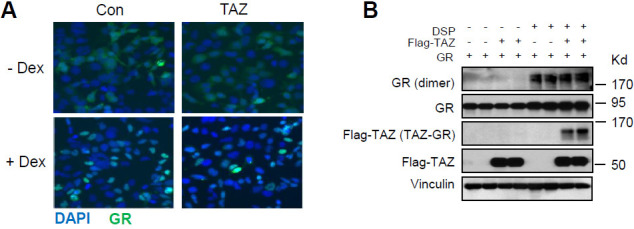
Figure 5—figure supplement 3. TAZ has no effects on glucocorticoid receptor (GR) nuclear localization or the amounts of GR dimer.


