
Author response image 1. PTT data plotted using SEM and SD.
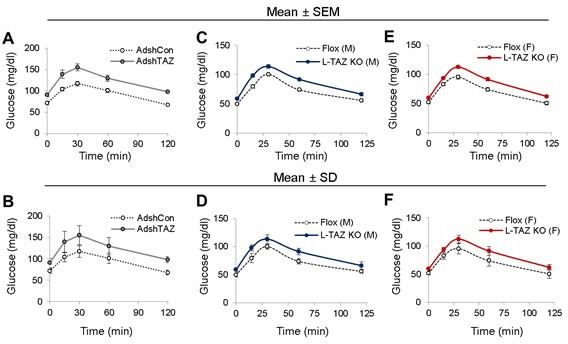
Figures 2G (A), 2L (C), and 2M (E), which are plotted using SEM, are compared with Figures R1B, R1D, and R1F, respectively, which are plotted using SD.
Official websites use .gov
A
.gov website belongs to an official
government organization in the United States.
Secure .gov websites use HTTPS
A lock (
) or https:// means you've safely
connected to the .gov website. Share sensitive
information only on official, secure websites.
Figures 2G (A), 2L (C), and 2M (E), which are plotted using SEM, are compared with Figures R1B, R1D, and R1F, respectively, which are plotted using SD.