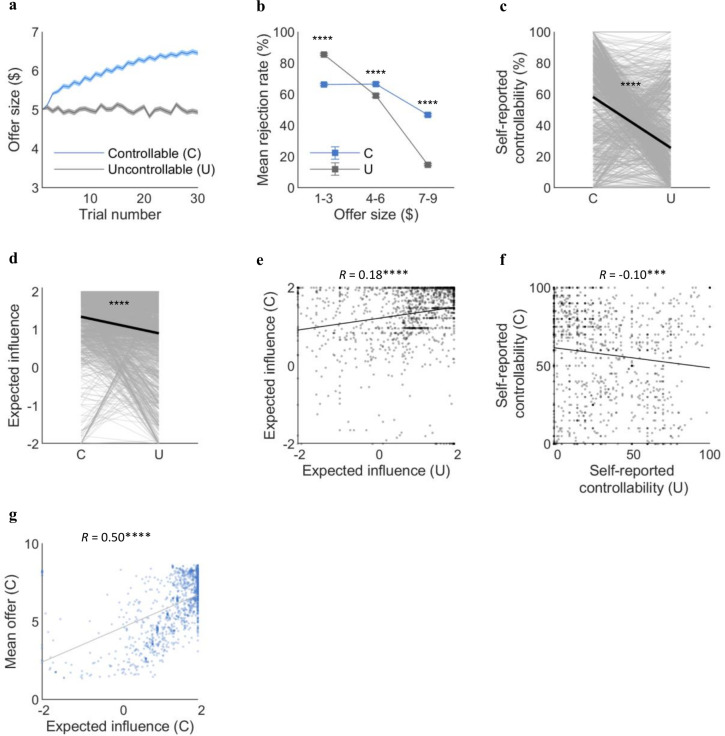
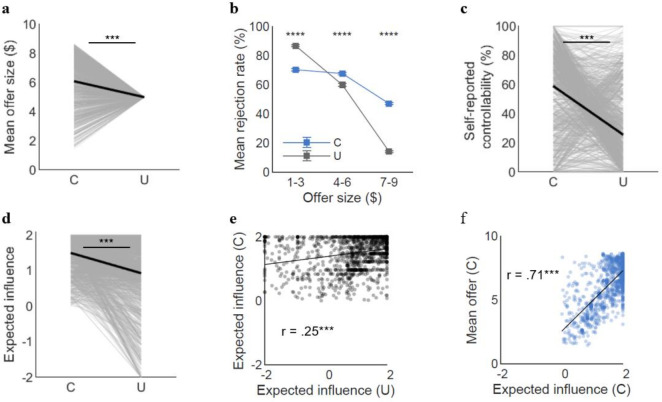
Figure 4. Replication of the behavioral and computational results in an independent large online sample (n=1342).
(a) Online participants successfully increased the offer under the Controllable condition as fMRI participants did (meanC=6.0, meanU=5.0, t(1,341)=20.29, p<<0.0001). (b) Rejection rates binned by offer sizes differed between the two conditions in the online sample (low ($1–3): meanC=66%, meanU=86%, t(741.54)=–12.28, p<<0.0001; middle ($4–6): meanC=67%, meanU=59%, t(2,606)=5.96, p<<0.0001; high ($7–9): meanC=47%, meanU=15%, t(1,925)=31.67, p<<0.0001). (c) Online participants reported higher self-reported controllability for the Controllable than Uncontrollable (meanC=58.3, meanU=25.6, t(2,579)=27.93, p<<0.0001). (d) Consistent with the fMRI sample, expected influence was higher for the Controllable than the Uncontrollable for the online sample (meanC=1.34, meanU=0.90, t(1,341)=12.97, p<<0.0001). (e) The expected influence was correlated between the two conditions (r=0.18, p<<0.0001). (f) The self-reported controllability showed negative correlation between the two conditions for the online sample (r=–0.10, p<0.001). (g) The significant correlation between expected influence and mean offers under the Controllable was replicated in the online sample (r=0.50, p<<0.0001). Each dot represents a participant. The t-statistics for the mean offer size, binned rejection rate, and self-reported controllability are from two-sample t-tests assuming unequal variance using Satterthwaite’s approximation according to the results of F-tests for equal variance. Error bars and shades represent SEM. For (c, d), each line represents a participant and each bold line represents the mean. C, controllable; U, Uncontrollable.
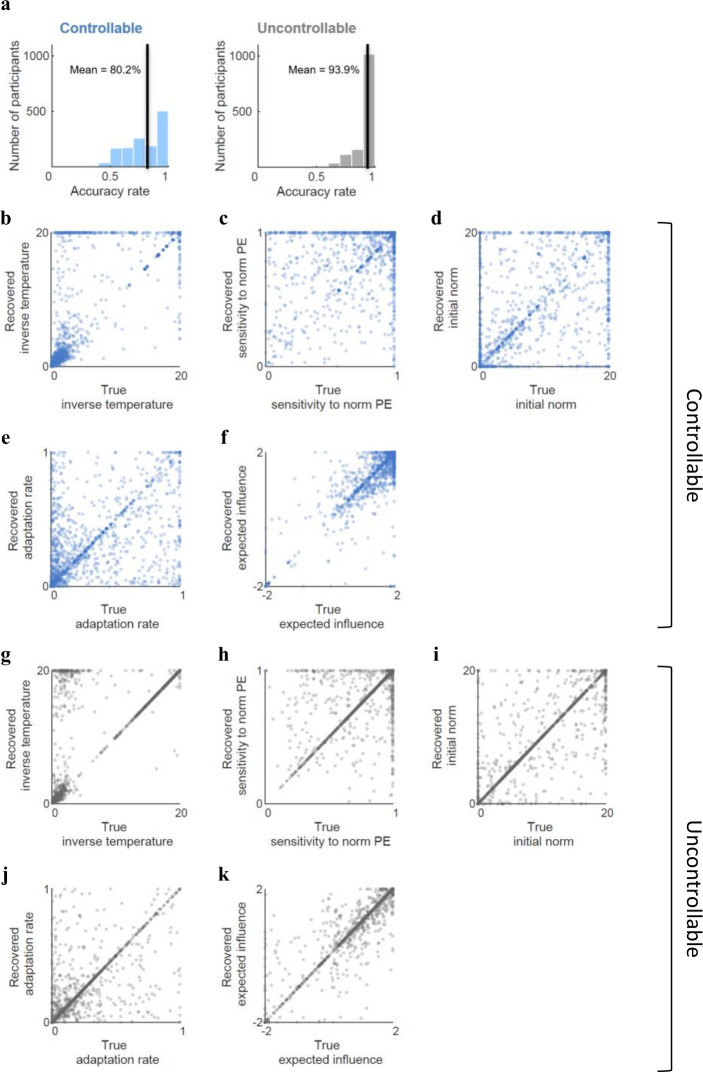
Figure 4—figure supplement 1. Model accuracy and parameter recovery for the online sample.
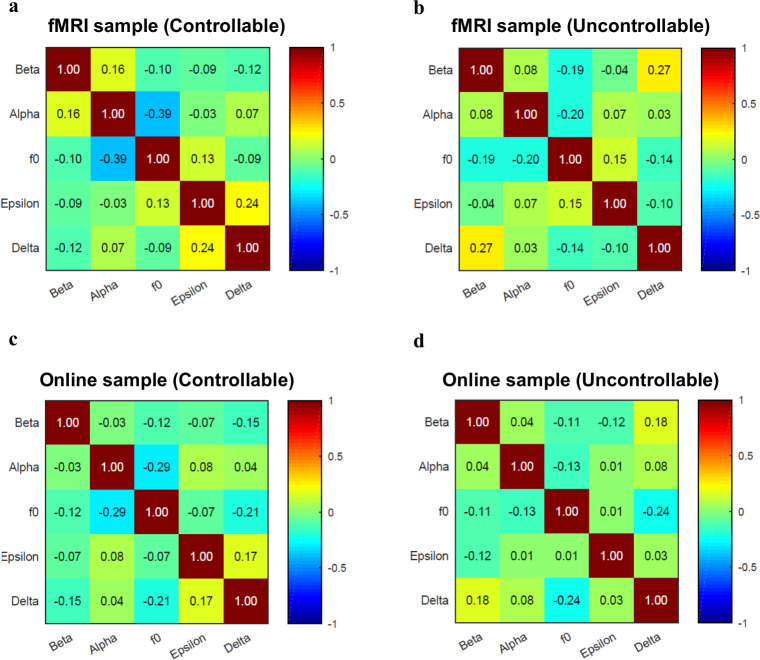
Figure 4—figure supplement 2. Cross-parameter correlations.
Figure 4—figure supplement 3. Online sample: results without those who had negative deltas.
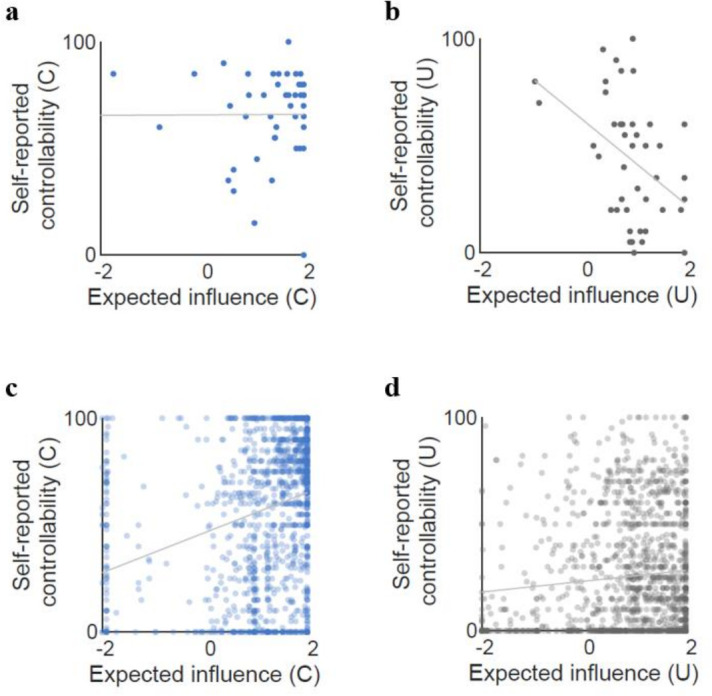
Figure 4—figure supplement 4. Correlations between expected influence and self-reported controllability for each condition and each sample.
