. 2021 Oct 29;10:e64983. doi: 10.7554/eLife.64983

Figure 5. The ventromedial prefrontal cortex (vmPFC) computes projected summed choice values in exerting social controllability.

(a) The vmPFC parametrically tracked mentally simulated values of the chosen actions drawn from the 2-step forward thinking (FT) model in both conditions (PFDR<0.05, k>50). (b) No activation was found in the brain including the vmPFC in relation with the value signals estimated from the 0-step model at a more liberal threshold (p<0.005, uncorrected, k>50). (c) The vmPFC ROI coefficients for the 2-step FT’s value estimates were significantly greater than 0 for both the Controllable and Uncontrollable conditions (Controllable: meanC=0.29, t(47)=1.96, p<0.05 (one-tailed); Uncontrollable: meanU=0.24, t(47)=2.14, p<0.05 (one-tailed)) whereas the coefficients from the same ROI for 0-step’s value estimates were not significant for either condition (Controllable: meanC=0.09, t(46)=0.69, p=0.25 (one-tailed); Uncontrollable: meanU=0.12, t(46)=1.17, p=0.12 (one-tailed)). The vmPFC coefficients were significantly higher under the 2-step model than the 0-step model for both the Controllable and Uncontrollable conditions (Controllable: t(46)=1.81, p<0.05 (one-tailed); Uncontrollable: t(46)=2.04, p<0.05 (one-tailed)). The coefficients were extracted from an 8-mm-radius sphere centered at [6, 52, −16] based on a meta-analysis study that assessed neural signatures in the ultimatum game (Feng et al., 2015). Error bars represent SEM; *p<0.05; n.s. indicates not significant. C, Controllable; ROI, region-of-interest; U, Uncontrollable.

Figure 5.

Figure 5—figure supplement 1. Neural encoding of value in the vmPFC is associated with behavior-belief disconnect under the Uncontrollable condition.
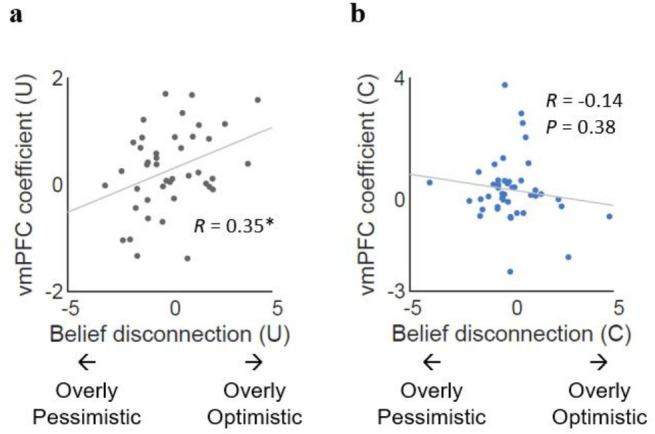
Figure 5—figure supplement 1.

(a) The disconnect between self-reported controllability (belief) and expected influence (exploited controllability) was calculated by subtracting the normalized expected influence from the normalized self-reported belief. Under the Uncontrollable condition, this ‘belief disconnect’ was positively correlated with beta coefficient extracted from the vmPFC ROI (r=0.35, p<0.05). (b) Under the Controllable condition, belief disconnect and beta coefficient extracted from the vmPFC ROI were not significantly correlated (r=–0.14, p=0.38). *p<0.05; n.s. indicates not significant. Each dot represents a participant. C, Controllable; ROI, region-of-interest; U, Uncontrollable; vmPFC, ventromedial prefrontal cortex.
Figure 5—figure supplement 2. Current and future value signals.
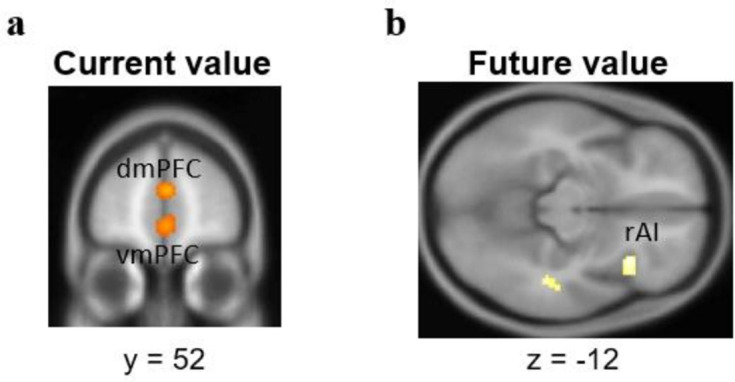
Figure 5—figure supplement 2.

We examined whether the current and future value terms under the same (2-step FT) model might be encoded by different neural substrates using a new set of GLMs with both the current and the future values without orthogonalization. We found that (a) the current value-alone signal was encoded in the vmPFC (peak voxel [2, 52, −4]) and the dmPFC ([2, 50, 18]), and (b) the future value-alone signal was tracked by the right anterior insula ([34, 22, −12]), at the threshold of p<0.001, uncorrected. Although these results did not survive the more stringent threshold applied to the main results (PFDR<0.05, k>50), all survived the small volume correction at PSVC<0.05. The results here are displayed at p<0.005, uncorrected, k>15. Together with our main result, these results indicate that the vmPFC encodes both current and total values estimated from the 2-step FT model; and that current and future value signals also had distinct neural substrates (dmPFC and insula). FT, forward thinking; vmPFC, ventromedial prefrontal cortex.
Figure 5—figure supplement 3. GLM comparison at the neural level.
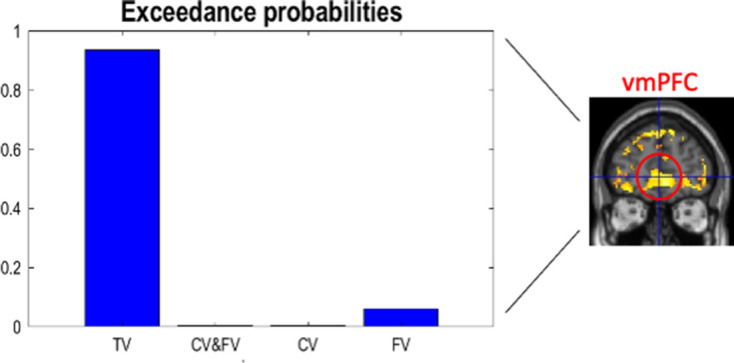
Figure 5—figure supplement 3.

To confirm that the vmPFC is encoding total values rather than only current or future values, we performed cross-validate Bayesian model selection (cvBMS) at the neural level using the MACS toolbox in SPM (Soch and Allefeld, 2018). We compared four different GLMs: (i) the GLM with total value (TV; our original GLM), (ii) the GLM with both current and future value without orthogonalization (CV & FV), (iii) the GLM with only current value (CV), and (iv) the GLM with only future value (FV), all estimates from the 2-step forward thinking (FT) model. First, we assessed each model at the individual level using the cross-validated log model evidence (cvLME) and computed exceedance probability (EP) of each model at the group level. EP was highest for our original model in the vmPFC. Bar graphs represent EP of each model at [0, 48, 0]. The highlighted voxels in the whole-brain image represent where TV was selected as the optimal model.
Figure 5—figure supplement 4. Norm prediction error signals.
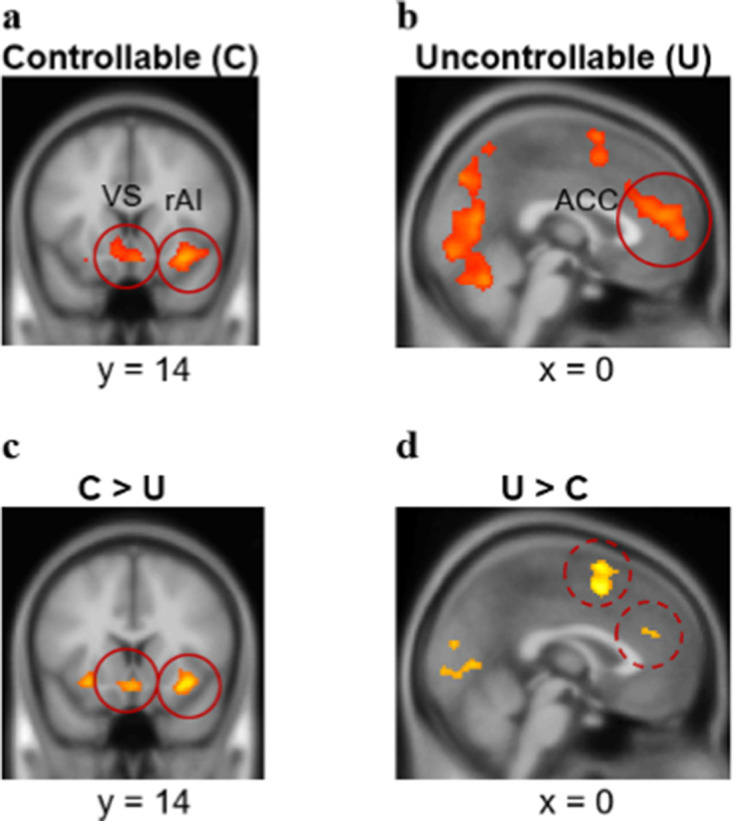
Figure 5—figure supplement 4.

Norm prediction error signals were found from (a) the ventral striatum (VS; [4, 14, −14]) and the right anterior insula (rAI; [32, 16, −14]) for the Controllable condition, while the signal was found from (b) the anterior cingulate cortex ([2, 46, 16]) for the Uncontrollable condition at PFWE<0.05, small volume corrected. These regions have been suggested to encode prediction errors in the similar norm learning context (Xiang et al., 2013). A whole-brain contrast of the two conditions revealed that (c) the VS ([4, 14, −14]) and the rAI ([32, 16, −14]) showed significantly greater BOLD responses for the Controllable than the Uncontrollable condition (PFWE<0.05, small volume corrected). However, (d) the ACC ([2, 46, 16]) response under the Uncontrollable condition was not significantly greater than the Controllable condition at the same threshold. Whole-brain analysis results were displayed at p<0.05, uncorrected, k>120. ACC, anterior cingulate cortex; BOLD, blood-oxygen-level-dependent.
Figure 5—figure supplement 5. Norm signals.
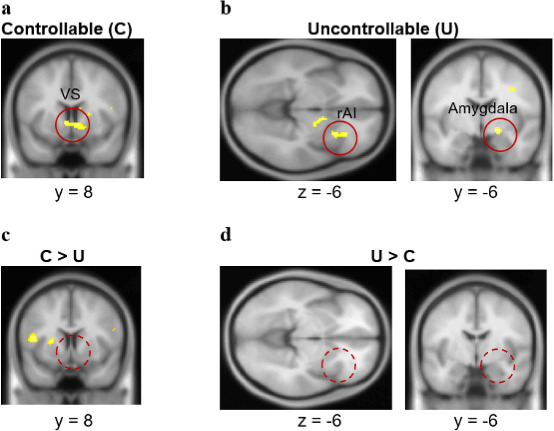
Figure 5—figure supplement 5.

Norm-related BOLD signals were found (a) from the ventral striatum ([10, 16, −2]) for the Controllable condition, and (b) from the right anterior insula ([28, 16, −6]) and the amygdala ([18, −6, −8]) for the Uncontrollable condition at PFWE<0.05, small volume corrected. (c, d) However, whole-brain contrast showed no difference between the conditions. Displayed at p<0.01, uncorrected, k>50. BOLD, blood-oxygen-level-dependent.