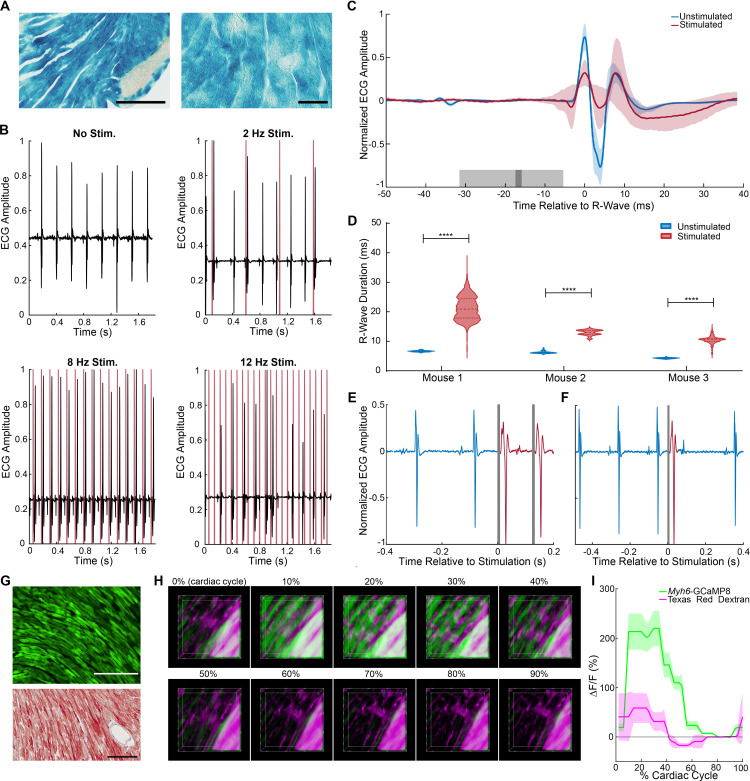
Figure 3. Cardiomyocyte optoeffector and optosensor mice.
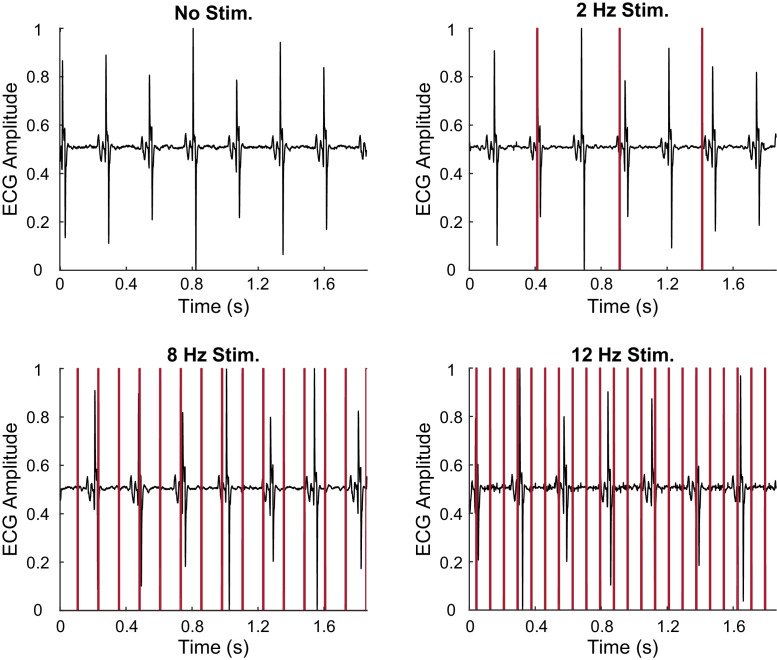
(A) X-gal staining of cardiomyocytes in Myh6-CatCh2_IRES_lacZ, scale bar: 200 and 60 µm. (B) ECG recording during intravital laser stimulation of the CatCh2 protein in the left ventricle at various frequencies (laser power is 32.2 mW, average pulse length is 14 ms). (C) R-wave-centered average of all stimulated and unstimulated beats shows R-wave widening (shading indicates standard deviation of ECG signal, dark and light gray indicate average and standard deviation of laser pulse onset and offset times). (D) R-wave durations with and without laser stimulation of the transgenic CatCh2 protein are shown from three different mice (****p<0.0001, Mann–Whitney test). Source data: Figure 3—source data 1 (E) ECG recordings demonstrating transition from autonomous to laser-stimulated conduction. (F) Premature ventricular contractions evoked by laser stimulation of Myh6-CatCh2 ventricular myocytes. (G) Expression of GCaMP8 in the heart of an adult Myh6-GCaMP8 mouse; top: native fluorescence; bottom: anti-GFP immunohistochemistry; scale bars: 200 µm. (H) Intravital two-photon microscopy of the Myh6-GCaMP8 heart. Frames from a three-dimensional reconstruction of Myh6-GCaMP8 fluorescence over a cardiac cycle. Each frame represents a 10% increment of the cardiac cycle defined by the peak of the R-wave. The x-axis is the anterior to posterior direction, the y-axis is the apex to base direction, and the z-axis is the epicardium to endocardium direction of the left ventricle free wall; 166 × 166 × 100 μm (xyz) region shown. GCaMP8 fluorescence in cardiomyocytes (green); vasculature labeled with Texas Red-conjugated dextran (magenta). (I) Average and standard deviation of change in fluorescence intensity of the imaged region demonstrating Ca2+ transients during the cardiac cycle. All images shown are representative images from three animals unless otherwise specified. The ECG data are from three animals.


