. 2021 Oct 29;10:e67858. doi: 10.7554/eLife.67858

Figure 4. Smooth muscle optoeffector and optosensor expression.

(A) Native fluorescence of surface blood vessels from Acta2BAC-GCaMP_GR (upper) and Acta2BAC-GCaMP8.1_mVermilion brain (lower). Note the absence of fluorescence in veins (arrows). Left panel: overlay; right panels: red and green channels. (B) X-gal staining of brain surface arteries from Acta2 optoeffector mice. All images shown are representative images from three animals unless otherwise specified.

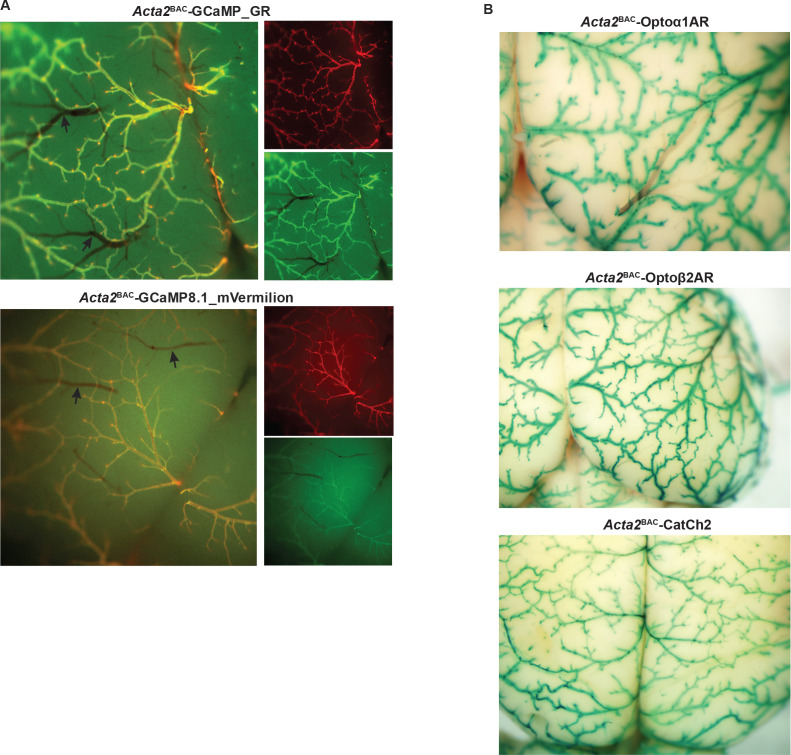
Figure 4.

Figure 4—figure supplement 1. Acta2BAC optogenetic reporter and effector lines.

Figure 4—figure supplement 1.

(A) RFP expression in Acta2BAC-RCaMP1.07. Upper panel: the RCaMP1.07 is expressed in coronary artery (A) but not veins (V). Scale bar: 100 µm. Lower panel: RCaMP1.07 fluorescence signaling in the right atrium (dashed line: right atrium). (B) GCaMP signal in longitudinal muscle of large intestine (taeniae coli) demonstrating intracellular Ca2+ concentration changes with muscle contraction and relaxation. Color scale shown below the images. (C) X-gal staining in various tissues from Acta2BAC effector mice and non-transgenic litter mate. Scale bars; Upper panels: 300 µm; Lower panels: 200 µm. All images shown are representative images from three animals unless otherwise specified.
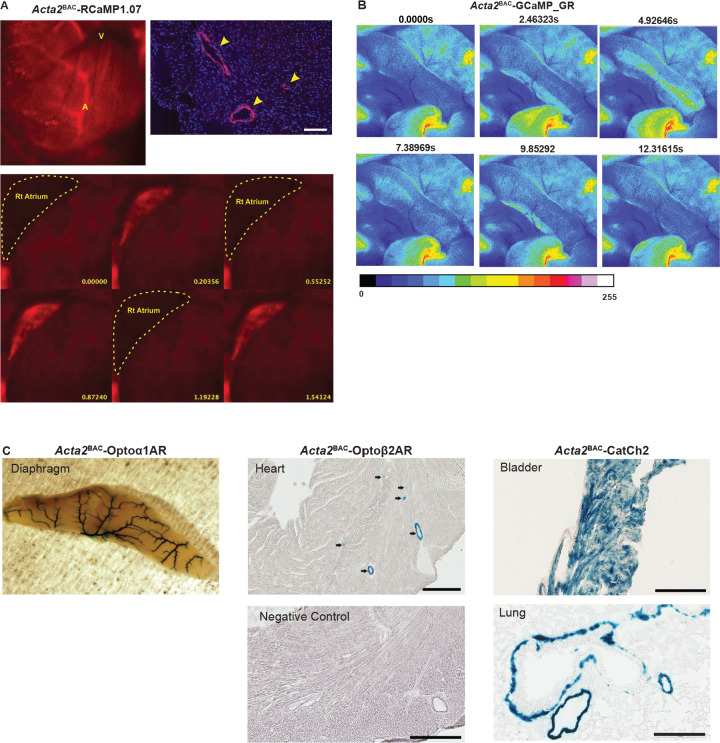
Figure 4—video 1. RCaMP1.07 fluorescence in right atrium of Acta2BAC-RCaMP1.07.
Download video file (1.3MB, mp4)
Figure 4—video 2. GCaMP fluorescence in large intestine of Acta2BAC-GCaMP_GR mouse.
Download video file (7.4MB, mp4)
The image was colorized in ImageJ; for color scale, see Figure 4—figure supplement 1.