. 2021 Oct 29;10:e67858. doi: 10.7554/eLife.67858

Figure 5. Smooth muscle optoeffector function.

(A) Activation of optogenetic proteins in effector lines results in either vessel contraction (Acta2BAC-Optoα1AR_IRES_lacZ: left panel; Acta2BAC-CatCh2_IRES_lacZ: right panel) or relaxation (Acta2BAC-Optoß2AR_IRES_lacZ: middle panel). Source data: Figure 5—source data 1. (B) Laser activation of transgenic Optoß2AR proteins induces K currents in isolated arterial myocytes. Upper panel: mesenteric myocytes; lower panel: cerebral myocytes. Source data: Figure 5—source data 2. (C) Laser activation of transgenic CatCh2 protein induces inward membrane current. Upper panel: repeated laser pulses result in rapid inward current in cerebral myocytes. Middle panels: long pulses achieve a steady-state inward current in cerebral (upper) and mesenteric myocytes (lower) after an initial spike only on the first pulse. Bottom panel: activation of cerebral myocytes results in higher initial and steady-state current compared to mesenteric myocytes. Optoα1AR and Optoß2AR data were derived from five cells isolated from three mice, and the CatCh2 data were generated from eight cells isolated from five mice.

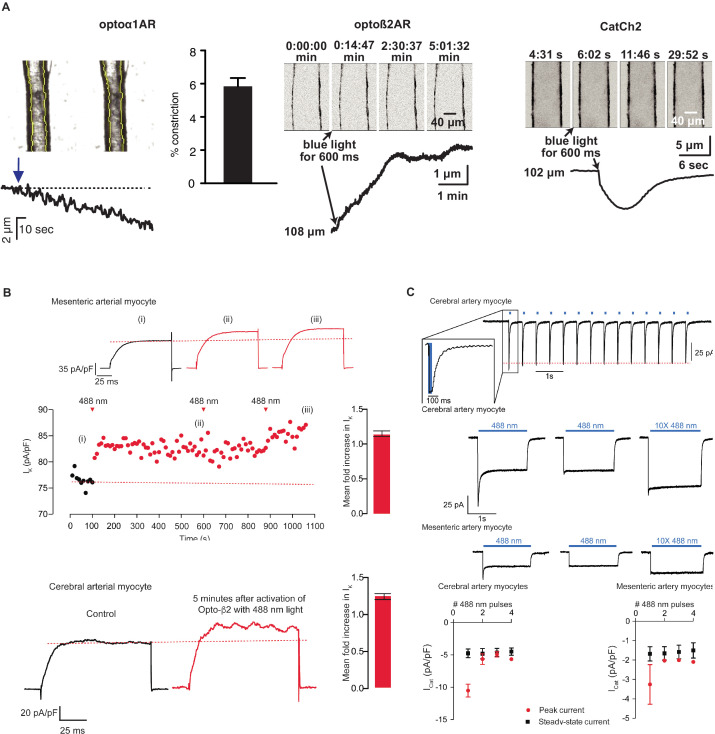
Figure 5—source data 1. Arterial diameter.
Figure 5—source data 2. K currents.

Figure 5.

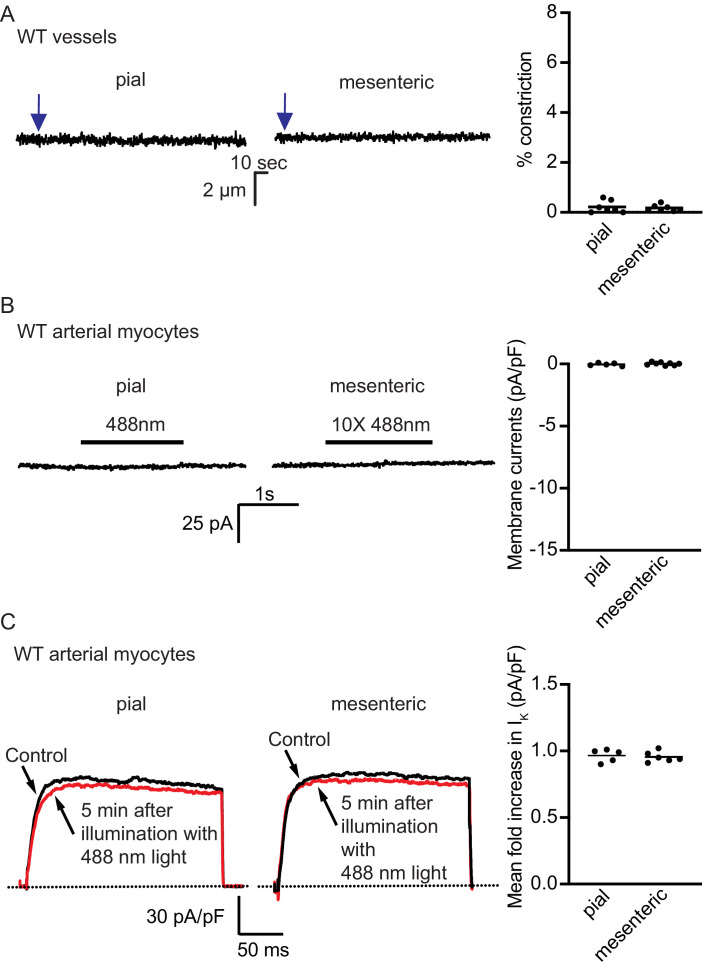
Figure 5—figure supplement 1. Light activation of wildtype control strains.

Figure 5—figure supplement 1.

(A) Representative arterial diameter records from pressurized WT pial (right) and mesenteric (center) vessels before and after (arrow) illumination with 488 nm light. The scatter plot to the left summarizes the % constriction from seven WT mesenteric and seven pial arteries after 488 nm light exposure (from three mice). Laser intensity was similar to the one used for the experiments in Figure 5. (B) Exemplar membrane current records from isolated WT pial (left) and mesenteric (center) arterial myocytes before and after successive low- and high-power (10×) illumination with 488 nm light. The scatter plot to the left summarizes the magnitude of the current change during 10 × 488 nm light exposure from WT five mesenteric and eight pial artery myocytes. (C) Kv current traces from representative pial (left) and mesenteric (center) artery myocytes. Currents were evoked with a voltage step from –70 mV to +50 mV before and after 488 nm laser light illumination. The scatter plot to the left summarizes the magnitude of the current change during 488 nm light exposure from WT six mesenteric and five pial artery myocytes.
Figure 5—video 1. Dilation of Acta2BAC-Optoß2AR artery stimulated with blue light.
Download video file (1.8MB, mp4)
Figure 5—video 2. Vasoconstriction of Acta2BAC-CatCh2 artery stimulated with blue light.
Download video file (412KB, mp4)