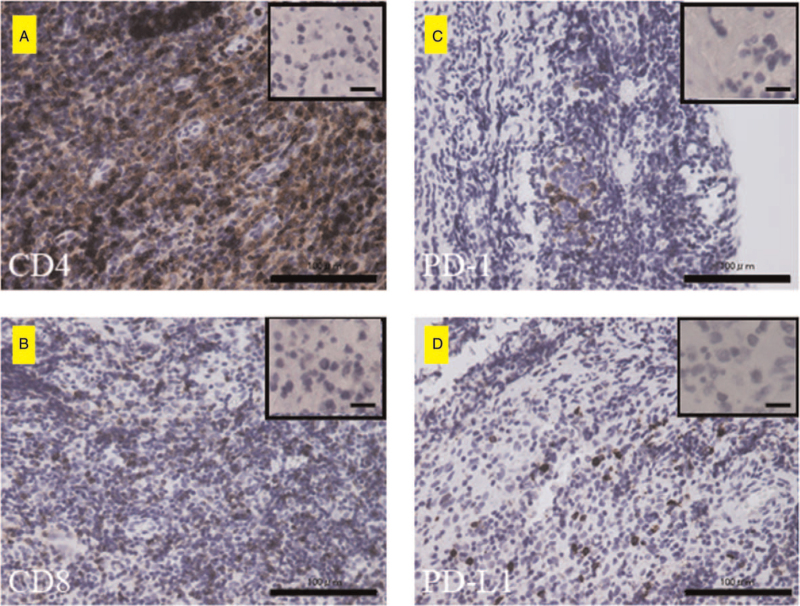
Figure 2.
The histological findings of immunohistochemistry for CD4, CD8, PD-1, and PD-L1. (A–C) indicate CD4-, CD8-, and PD-1-positive lymphocytes, respectively. (D) PD-L1-positive tumor cells. Scale bar = 100 μm. The images in the upper right frame are the negative control in each (Scale bar = 10 μm). The CD4-positive and PD-L1-positive co-staining rates were 5/6 (83.3%). The CD8-positive and PD-L1-positive co-staining rates were 5/6 (83.3%). The PD-1 and PD-L1 concordance rates were 1/6 (16.6%). Interestingly, PD-L1 positivity was observed not only in the tumor cells but also in lymphocytes (Figure 3A and 3B).

