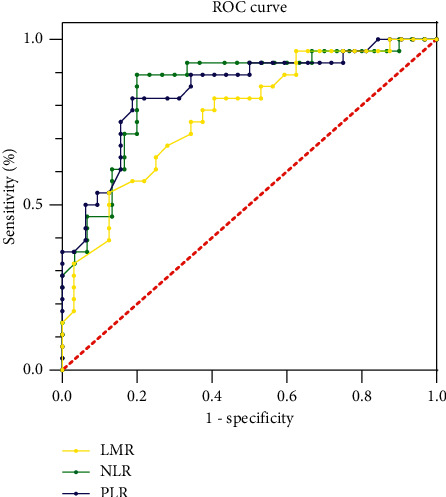
Figure 2.

Predictive value of NLR, PLR, and LMR for efficacy in RA patients. The closer to the upper left of the standard line, the higher the forecast value of the indicator. If it is located at the lower right of the standard line, there is no forecast value.
