
Figure 3.
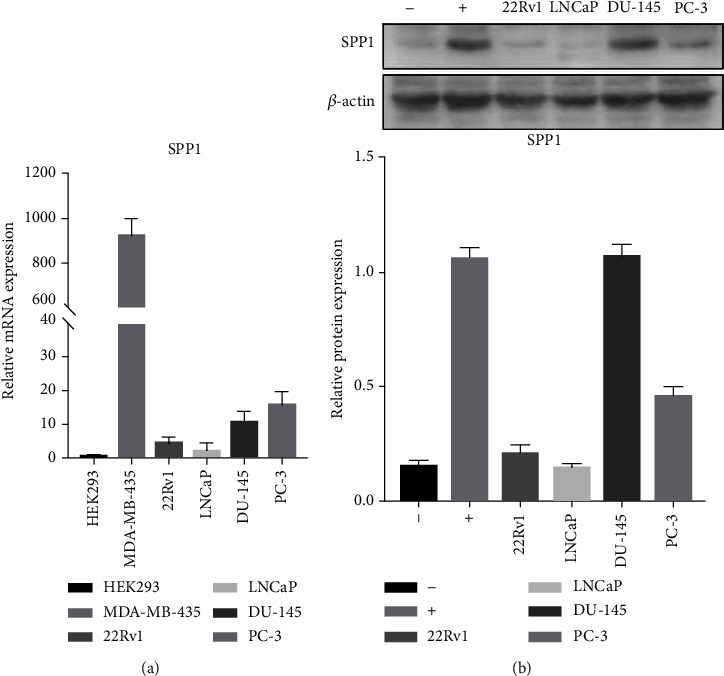
Expression of SPP1 in different derived PCa cells. (a). RNA expression level in four groups of cell lines (PC-3, DU-145, LNCaP, and 22Rv1) with SPP1 negative and positive expression cells as control groups. (b). Protein expression level in PC-3, DU-145, LNCaP, and 22Rv1 with SPP1 negative (-) and positive (+) expression cells as control groups.