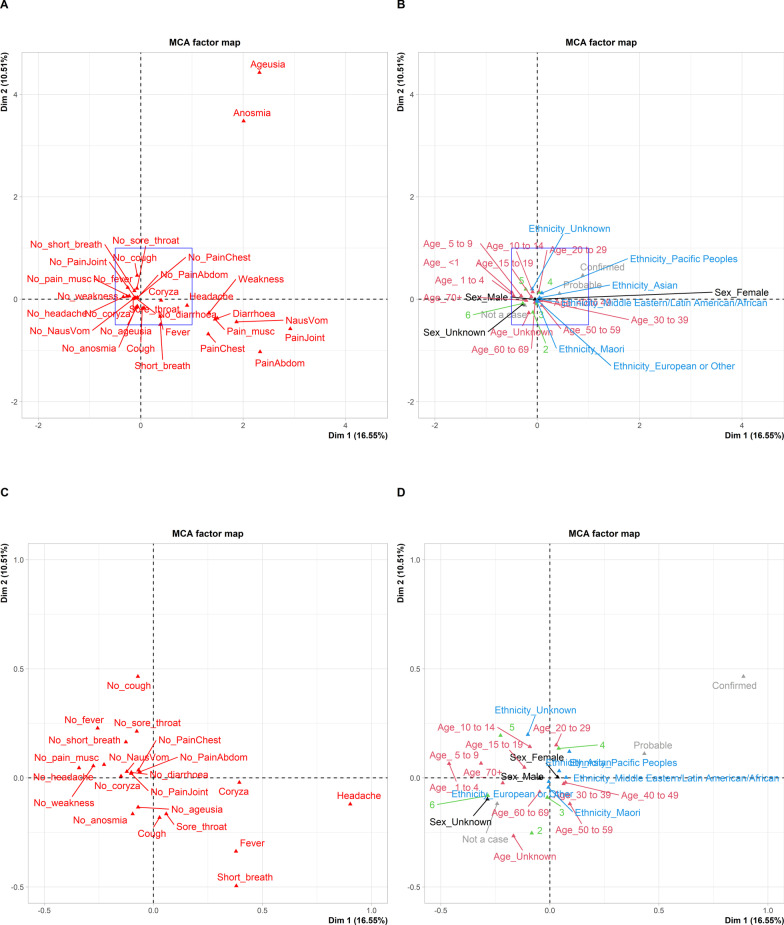
Fig. 2.
A, B Multiple Correspondence Analysis of 1125 cases, 349 probable cases and 4750 non-cases presenting for SARS-CoV-2 PCR testing during the first wave of COVID-19 in New Zealand, showing the correlation between symptom variables A and supplementary variables B with the first two dimensions, which accounted for ~ 30% of the variation. Supplementary variables were age category (magenta), priority ethnicity (blue), sex (black), disease status (grey) and month of year (green). The blue box is expanded in (C, D). C, D Multiple Correspondence Analysis showing the correlation between symptom variables C and supplementary variables D with the first two dimensions, with the axes cropped as indicated by the blue boxes in (A, B)

