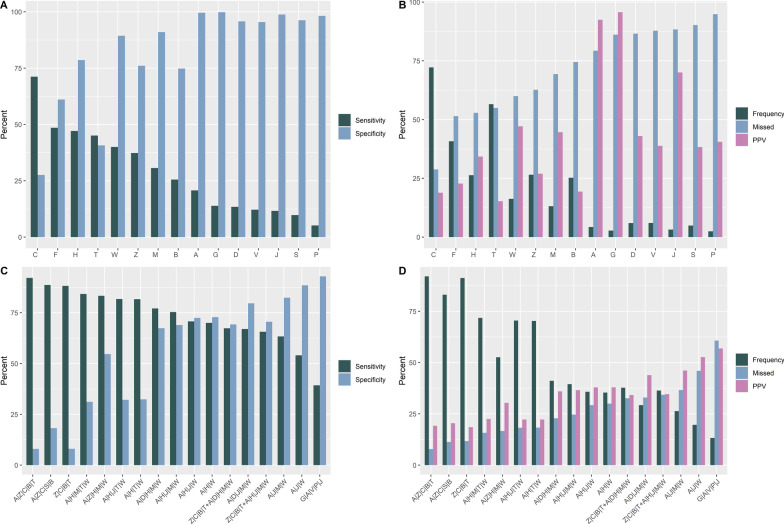
Fig. 4.
Examples of the characteristics of different individual symptoms and combinations of symptoms linked by ‘OR’ statements in individuals (1125 cases, and 4750 non-cases) presenting for SARS-CoV-2 PCR testing during the first wave of COVID-19 in New Zealand. A, B show the sensitivity, specificity, positive predictive value and proportion of false negatives (i.e. 1-sensitivity, labelled as ‘missed’) assuming the PCR is a gold standard, and the frequency of individual symptoms, expressed as percentages. C, D show the same metrics for a selection of combinations of symptoms. The examples ZCTB_AHJMW and ZCTB_ADHMW are rules based on one or more of four respiratory symptoms (coryza, cough, sore throat or shortness of breath, Z|C|T|B) AND one or more of 5 non-respiratory symptoms

