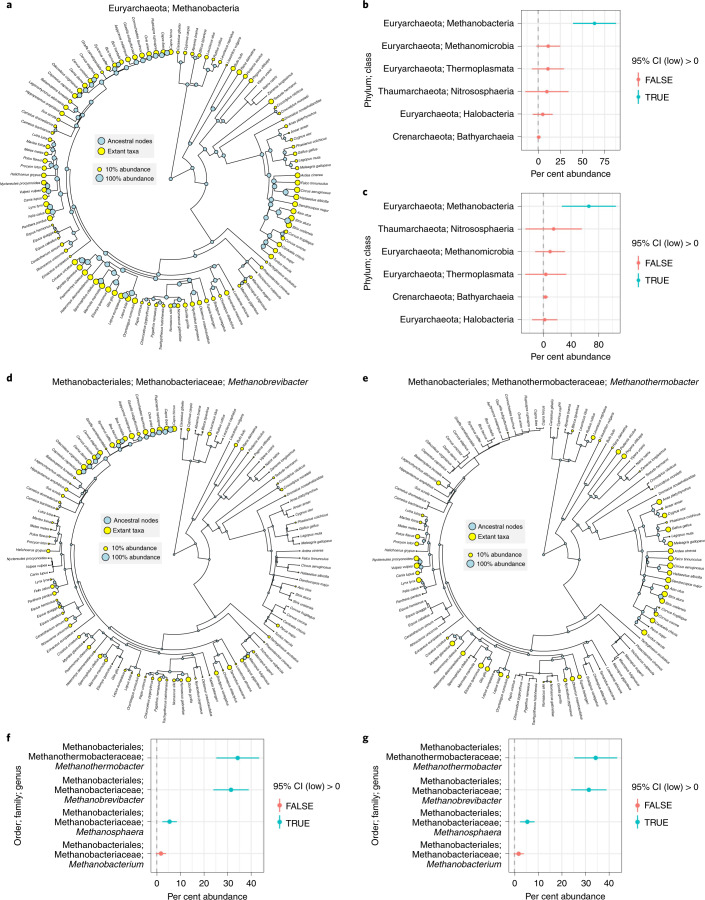
Fig. 3. Ancestral state reconstruction evidences Methanobacteria association with ancestral vertebrate gut.
a, Predicted abundances of Methanobacteria for each extant host species (yellow circles) and ancestral host species (blue circles). Circle size denotes relative abundance (min = 1%, max = 100%). The phylogeny is the same as shown in Fig. 1. b,c, Estimated Methanobacteria abundance (points) with 95% CIs (line ranges) for the LCA of all mammalian species (b) and all five taxonomic classes (c). d,e, The trees are as in a but show the predicted abundances of the Methanobrevibacter and Methanothermobacter genera, respectively. f,g Plots as in b and c, respectively, but showing predictions of abundances for all four genera in the Methanobacteria class. The sample sizes for b, c, f and g are all 110. See the statistical source data for all other statistical information.

