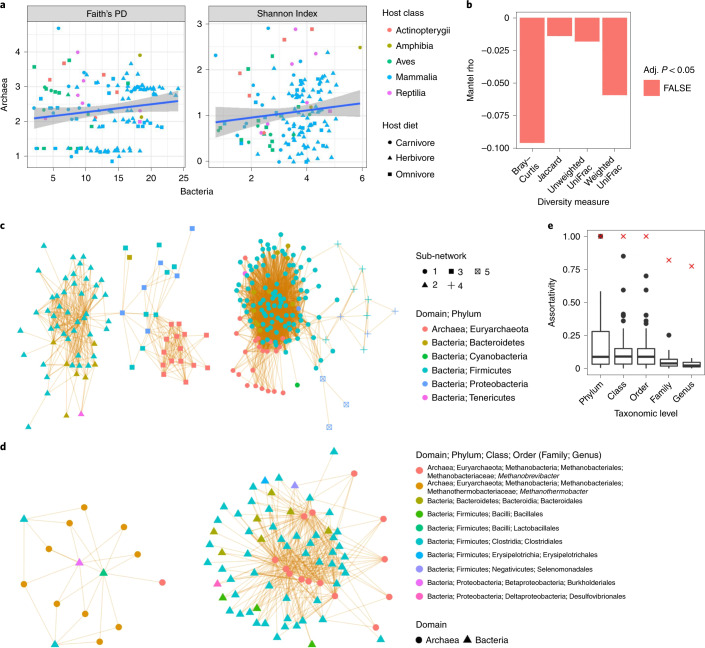
Fig. 4. Limited associations between archaeal and bacterial diversity.
a, Linear regressions (blue lines) of archaeal versus bacterial community diversity as measured via Faith’s PD and the Shannon Index. The grey areas denote 95% CIs. b, Mantel tests comparing archaeal and bacterial beta diversity (999 permutations per test). c, Archaea–Bacteria ASV co-occurrence network, with nodes coloured at the phylum level. Orange edges indicate significant positive co-occurrences. d, Subnetworks only (determined via the walktrap algorithm; see Methods) of the co-occurrence network shown in c that contain archaeal ASVs. e, Taxonomic assortativity of just Archaea–Archaea edges (red X) versus just Bacteria–Bacteria edges (box plots), with Bacteria subsampled to the same number of ASVs as Archaea (100 subsample permutations). Box centre lines, edges, whiskers and points signify the median, IQR, 1.5× IQR and >1.5× IQR, respectively. See the statistical source data for all other statistical information.

