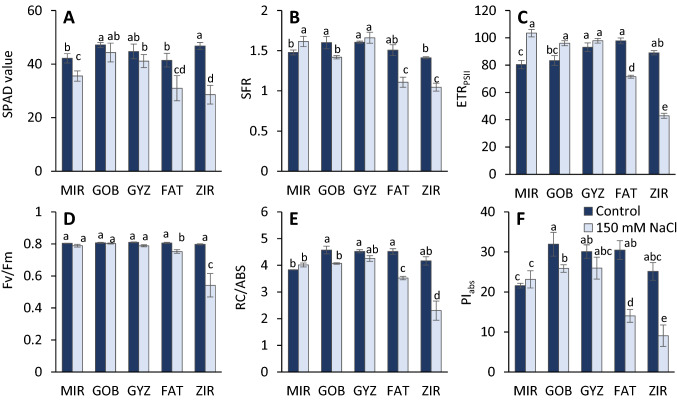
Fig. 2.
Effect of salinity on the values of parameters derived from noninvasive measurements of leaf absorbance and fluorescence: chlorophyll content measured in SPAD values (A), fluorescence ratio F735/F685 derived from multispectral fluorescence records (B), rate of linear electron transport calculated from the fluorescence quenching analysis in the light-adapted state (C), the maximum quantum yield of PSII photochemistry (D), reaction centers per absorbed light unit: RC/ABS (E), and Performance Index: PIabs (F) derived from the analysis of fast fluorescence kinetics in dark-adapted leaves of different wheat genotypes (MIR Mirbashir 128, GOB Gobustan, GYZ Gyzyl Bughda, FAT Fatima, ZIR Zirva 80). All data are presented as the mean value ± standard error (SE). Data in columns with the different letters are significantly different according to Duncan's multiple range test at P = 0.05

