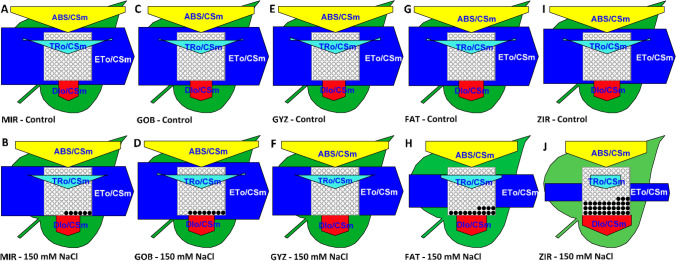
Fig. 4.
Phenomenological leaf models based on calculations of parameters derived from the analysis of fast fluorescence kinetics in dark-adapted leaves of different wheat genotypes (MIR Mirbashir 128, GOB Gobustan, GYZ Gyzyl Bughda, FAT Fatima, ZIR Zirva 80) in non-stressed (Control) and salt-stressed (150 mM NaCl) variants. The thickness of each arrow represents the mean value of absorbance (ABS/CSm), trapping flux (TR/CSm), electron transport (ET/CSm), or heat dissipation of excess light (DI/CSm), all expressed per leaf cross-section. The black points represent the fraction of inactive reaction centers. The models were generated using software Biolyzer 3.06 (Maldonado-Rodriguez, Laboratory of Bioenergetics, University of Geneva, Switzerland)

