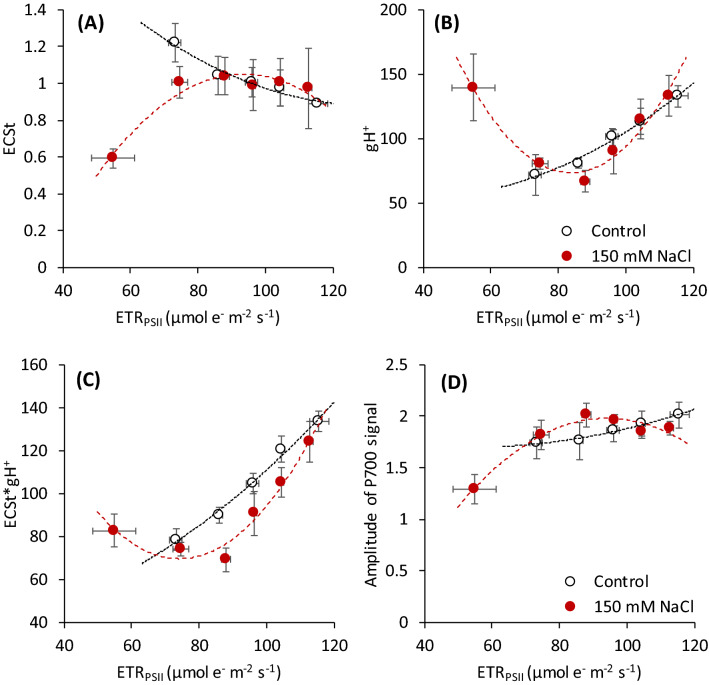
Fig. 5.
Relationship between the mean values of PSII electron transport rate (ETRPSII) and the parameters related to the proton transport and PSI activity analyzed simultaneously by the multisensor MultispeQ V2.0 (PhotosynQ, USA) in non-stressed (Control) and salt-stressed (150 mM NaCl) wheat plants. (A) The maximum amplitude of absorbance at 520 nm (ECS signal) measured with the far-red pulse and saturating light pulse, (B) proton conductivity of the thylakoid membrane through ATP synthase (gH+), (C) the proton flux estimated as a product of ECSt and gH+, and (D) the amplitude of P700 signal measured as an absorbance signal at 820 nm. Data originate from the entire tested collection of wheat genotypes. The points represent the mean values of the samples in two variants sorted according to the ETRPSII values into the six separate groups. The samples with very low ETRPSII values (< 60 µmol e− m−2 s−1) were present only in the salt-stress variant. Data are presented as the mean value ± standard error (SE) from 10 to 20 leaves

