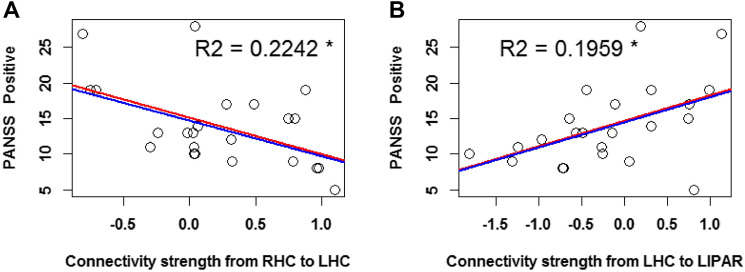
Fig. 6.
Linear regression with severity of positive symptoms (as reflected by PANSS 3 factor scores) as regressors. The predicted variables are the connectivity strengths of the following parameters: A from the RHC to the LHC, and B from the LHC to the LIPAR. The red regression line reflects the fit of the simple linear regression model, while the blue line reflects that of the robust regression model. The plotted R2 values reflect the simple linear regression model fit. The asterisk indicates an uncorrected p < 0.05 significance level

