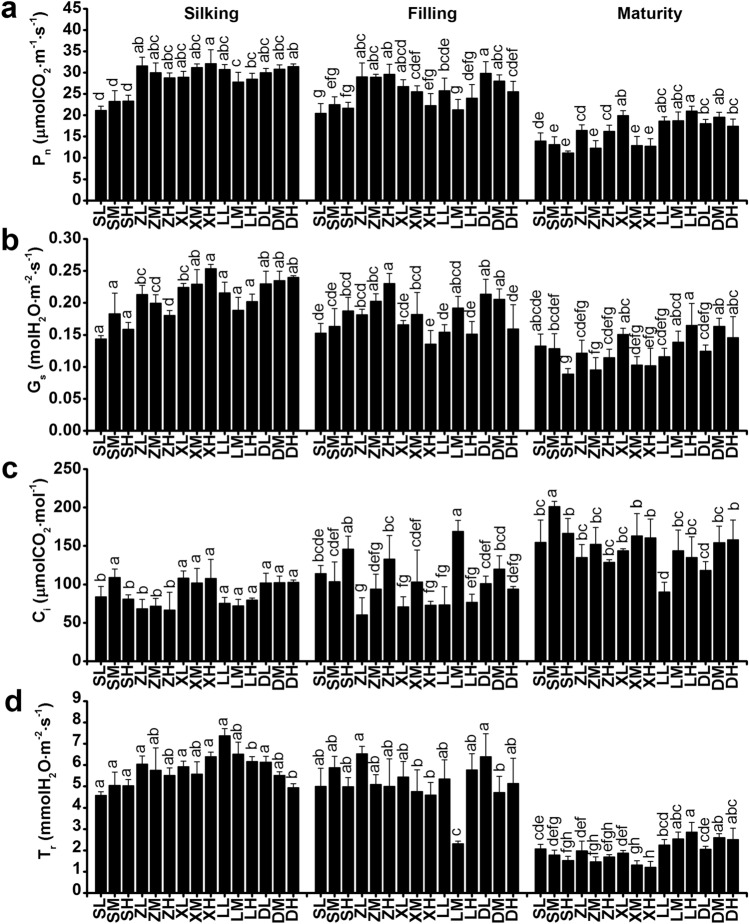
Fig. 2.
Photosynthetic characteristics of the ear leaf at the silking, filling, and maturity stages, as influenced by plant density in 2017. Different lowercase letters indicate significant differences (p < 0.05) between treatments. Pn, net photosynthetic rate; Gs, stomatal conductance; Ci, intercellular CO2 concentration; Tr, transpiration rate. SL, SC704 at low density; SM, SC704 at medium density; SH, SC704 at high density; ZL, ZD958 at low density; ZM, ZD958 at medium density; ZH, ZD958 at high density; XL, XY335 at low density; XM, XY335 at medium density; XH, XY335 at high density; LL, LY66 at low density; LM, LY66 at medium density; LH, LY66 at high density; DL, DH618 at low density; DM, DH618 at medium density; DH, DH618 at high density

