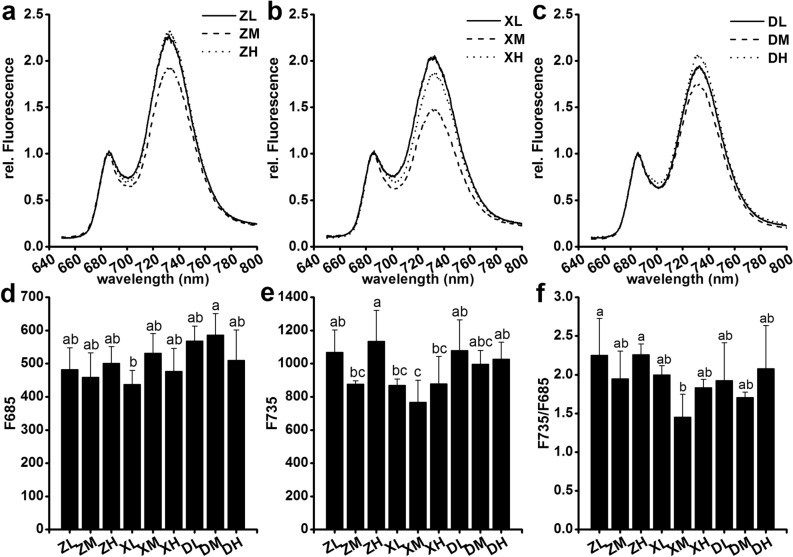
Fig. 6.
77K fluorescence emission spectra of the ear leaf at the filling stage in 2017. a–c 77 K fluorescence emission spectra after excitation at 435 nm. The chlorophyll concentration was adjusted to 10 μg/ml. The values were normalized to the emission at 685 nm. d–f 77 K fluorescence emission at 685 nm and 735 nm and the F735/F685 ratio. Different lowercase letters at the same growth stage indicate significant differences (p < 0.05) between treatments

