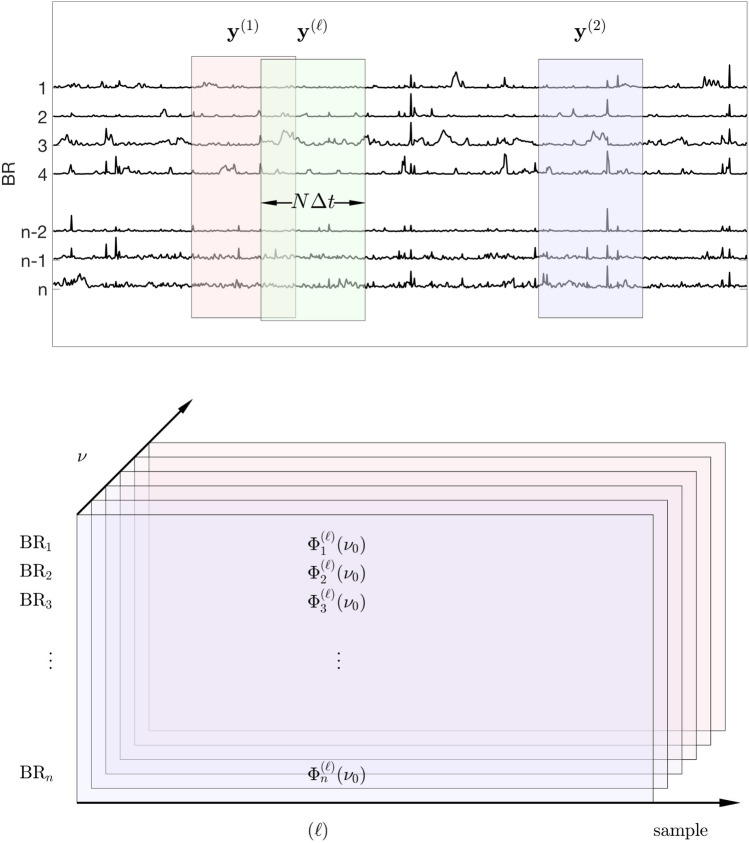
Fig. 1.
Top: A schematic picture of the bootstrap process. The matrices with entries as defined in Eq. (4) comprise random cuts of fixed width from the brain activity time series matrix. The sample vectors are Fourier transformed row-by-row, and the periodogram matrices are row-wise scaled squared amplitudes of the transforms, each row corresponding to a BR, the columns referring to the frequencies. Bottom: Organization of the bootstrapped periodogram data into a three-dimensional array. Each array corresponds to one meditation protocol and one meditator. The power spectra are computed by averaging over the samples (dimension 2), and the spectral density sample matrices are computed by integrating (or in practice, summing) over a given spectral band (dimension 3)

