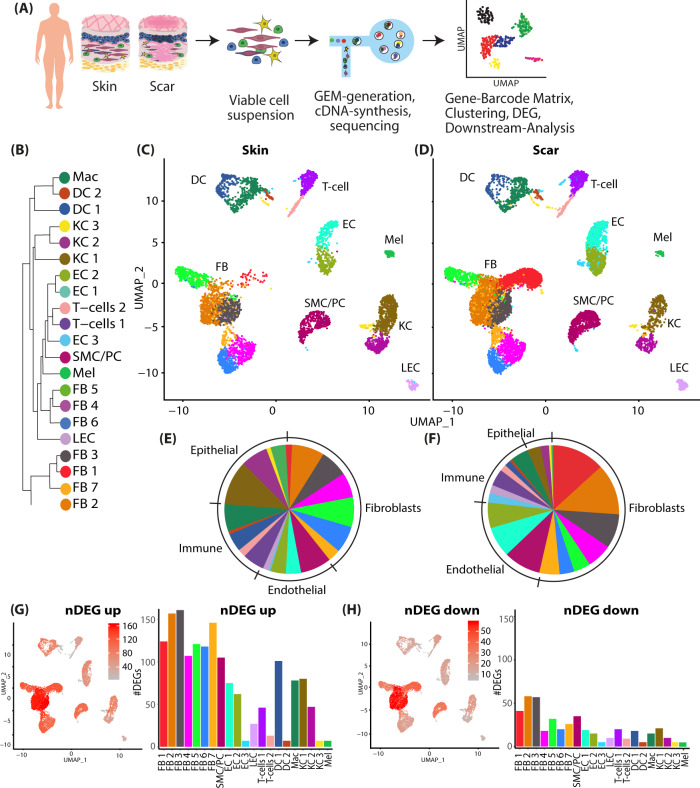
Fig. 1. Characterization of human skin and scar samples with scRNAseq identifies specific cell clusters and a distinct fibrotic gene signature.
A Workflow of scRNAseq in human skin (n = 3) and scar (n = 3) samples. B Phylogenetic clustertree calculated based on UMAP-clustering. C, D UMAP-plots of human skin and scar samples, split by tissue, after integration of all samples, identifying seven fibroblast clusters (FB1-7), smooth muscle cells and pericytes (SMC/Peri), endothelial cells (EC1 + 2), lymphatic endothelial cells (LEC), T cells, macrophages (Mac), dendritic cells (DC1 + 2), three keratinocyte clusters (KC1-3), and melanocytes (Mel). E, F Pie charts showing ratios of cell clusters in skin and scars. Feature plots and bar graphs of number of differentially expressed genes (nDEG) per cluster of G up- and H downregulated genes. DEGs were calculated per cluster comparing scar versus skin using Wilcoxon rank-sum test, including genes with average logarithmic fold change (avglogFC) of >0.1 or <−0.1 and Bonferroni-adjusted p-value <0.05. Feature plots show projection of nDEG onto the UMAP-plot, color intensity represents nDEG. Bar graphs show absolute numbers of nDEG per cluster, y-axis represents nDEG. UMAP, uniform manifold approximation and projection.

