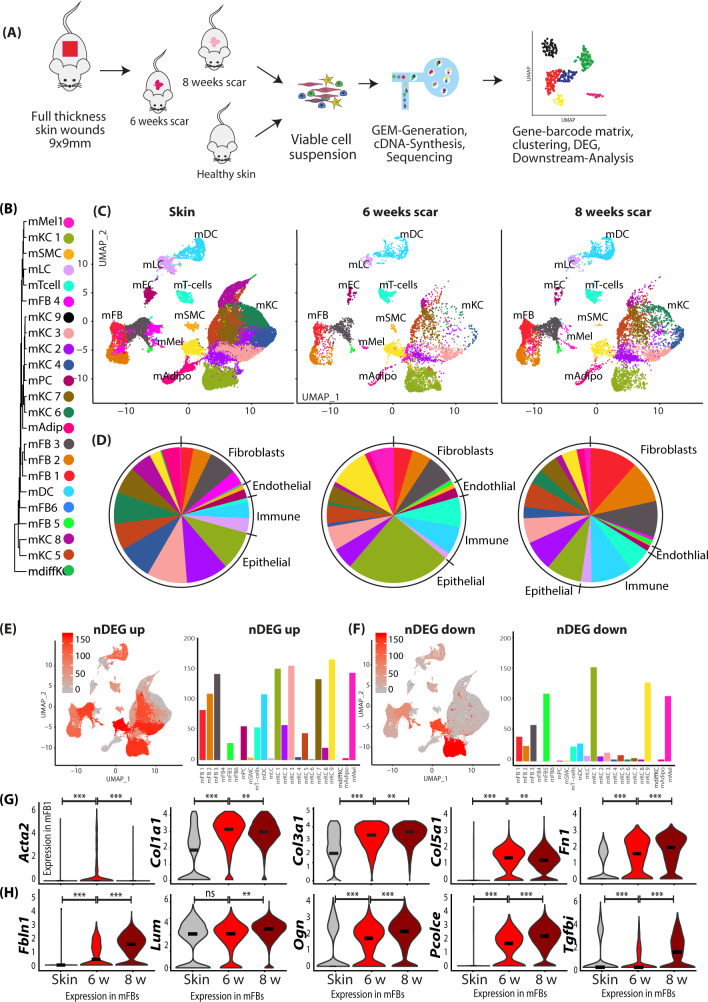
Fig. 4. Two-timepoint mouse scar model identifies genes regulated in scar maturation.
A Workflow of mouse skin scar model and two-timepoint (n = 2 per timepoint) scRNAseq. B Phylogenetic clustertree calculated unsupervised based on unsupervised UMAP-clustering. C UMAP-plots of mouse scar tissue, split by timepoint, after integration of all samples, identifying four fibroblast clusters (mFB1-4), smooth muscle cells and pericytes (mPC/SMC), endothelial cells and lymphatic endothelial cells (mEC/LEC), T cells, dendritic cells (mDC), Langerhans cells (mLC), nine keratinocyte clusters (KC1-9), adipocytes (mAdipo), and melanocytes (Mel). D Pie charts show relative numbers of cells in clusters, split by timepoint. Feature plots and bar graphs of number of differentially expressed genes (nDEG) per cluster of E up- and F downregulated genes per cluster. G, H Violin plots of ECM-associated genes. Acta2 skin vs 6w p = 2.22e−16; 6w vs 8w p = 1.4e−6; Col1a1 p = 2.22e−16, p = 0.23; Col3a1 p = 2.22e−16, p = 0.0079, Col5a1 p = 2.22e−16; p = 5e−5, Fn1 p = 2.22e−16; p = 5.5e−10; Fbln1 p = 1.3e−10, 2.22e−16; Lum p = 0.065, p = 2.22e−16; Ogn p = 9.3−0.5, p = 2.22e−16; Pcolce p = 2.22e−16, 2.22e−16; Tgfbi p = 0.023, p = 2.22e−16. Vertical lines in violin plots represent maximum expression, shape of each violin represents all results, and width of each violin represents frequency of cells at the respective expression level. DEGs were calculated per cluster comparing 8- vs 6-week-old scars using a two-sided Wilcoxon-signed rank test, including genes with average logarithmic fold change (avg_logFC) of >0.1 or <−0.1 and Bonferroni-adjusted p-value <0.05. Feature plots show projection of nDEG onto the UMAP-plot, color intensity represents nDEG. Bar graphs show absolute number of nDEG per cluster, y-axis represents nDEG. UMAP uniform manifold approximation and projection.

